
Profiling in Audio Weaver: Tips and Tricks
About This Application Note
The Profiling in Audio Weaver: Tips and Tricks Application Note contains instructions for computational and memory profiling of and Audio Weaver Designer (.awd) signal flow in Audio Weaver. The profiling works for both Native (PC) and on embedded targets and in real time on a running .awd layout.
Real-Time Block by Block Profiling
This profiling happens while the audio processing is running in real-time. Additionally, there is a manual audio pump feature which does similar profiling but operates in non-real-time.
Manual Profiling
Real Time Profiling
In Audio Weaver, Design Mode refers to a non-running .awd, while Tuning Mode refers to a running .awd layout. You can enter Tuning Mode by clicking the run button in Audio Weaver Designer:

While an .awd is in Tuning Mode (running), the entire layout can be profiled in real time. Profiling a running .awd will yield the following information:
Memory usage and cycle consumption of complete system
Memory usage and cycle consumption of each module
Memory usage of all the wires
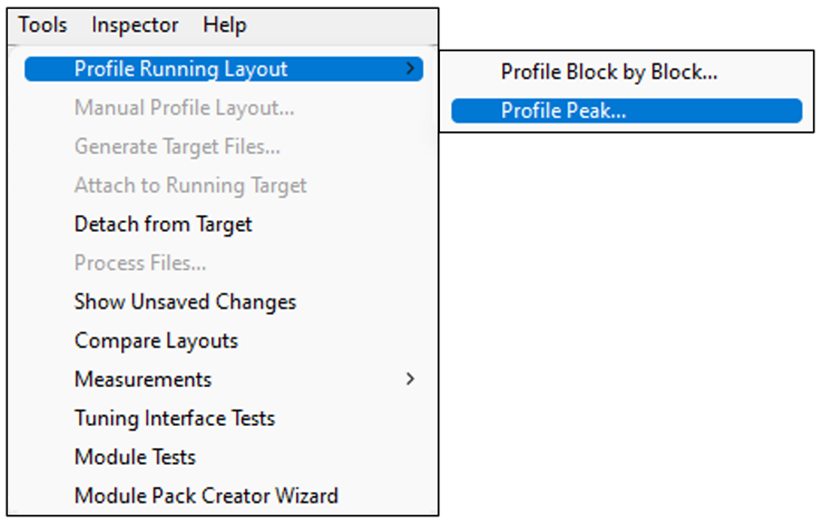
To profile a running .awd in real time, navigate to the ‘Tools > Profiling Running Layout’ menu in the Audio Weaver Designer toolbar while in Tuning Mode:
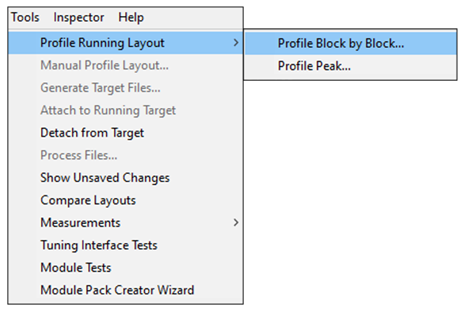
Profiling Running Layout
There are two options for profiling a running .awd layout in real time:
Profile Block by Block
Profile Peak
The ‘Block by Block’ profiling will provide information MHz and Memory consumption of each individual element of the .awd at the time of the profiling, while ‘Peak’ profiling will provide information about average and peak CPU cycle usage over a specified time.
Block by Block Profiling
Peak Profiling
Selecting ‘Profile Block by Block’ will automatically run profiling on the entire running .awd layout at the time of selection, while ‘Profile Peak’ is manually started once the desired Sampling Period and Length of Test fields are set:

Peak Profiling Sampling Period & Length of Test
Understanding Real Time Profiling Information
Block by Block Profiling
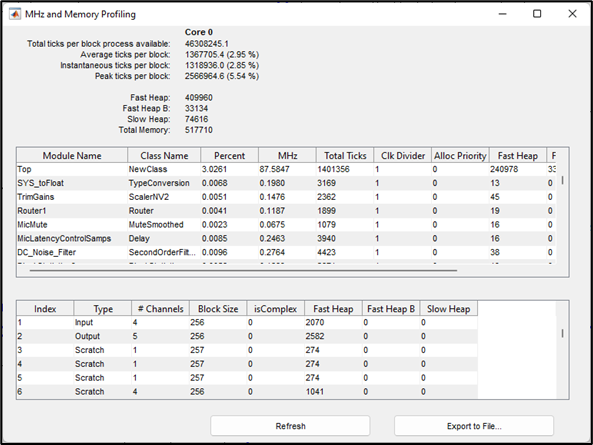
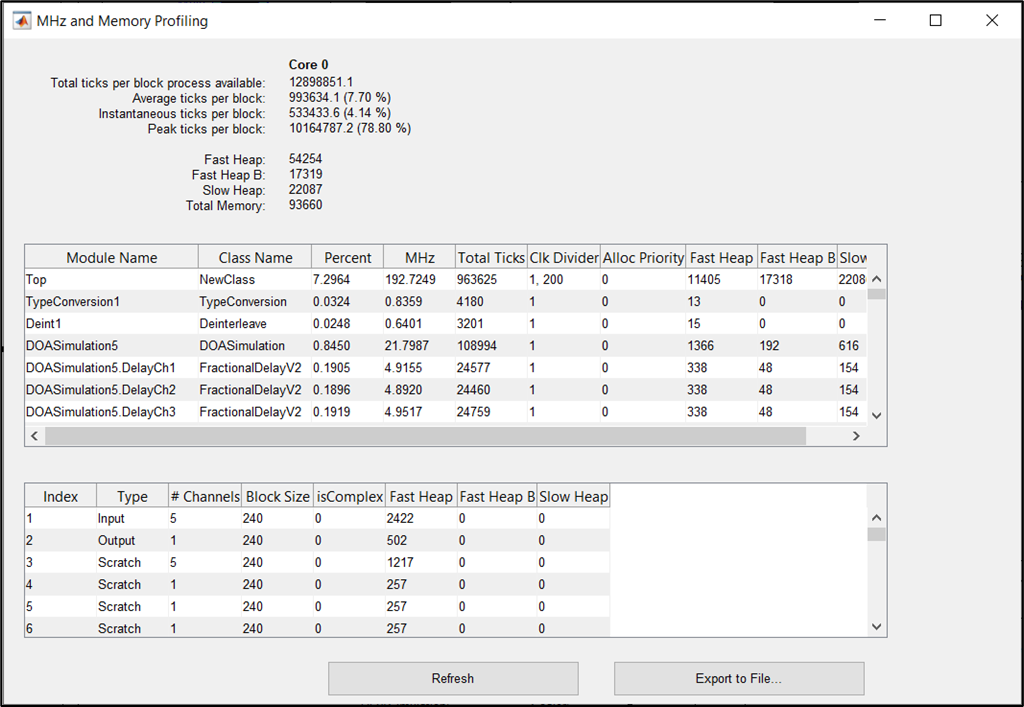
When selecting the Profile Block by Block real time profiling option, a window with the complete profiling data of the running .awd layout will pop up:
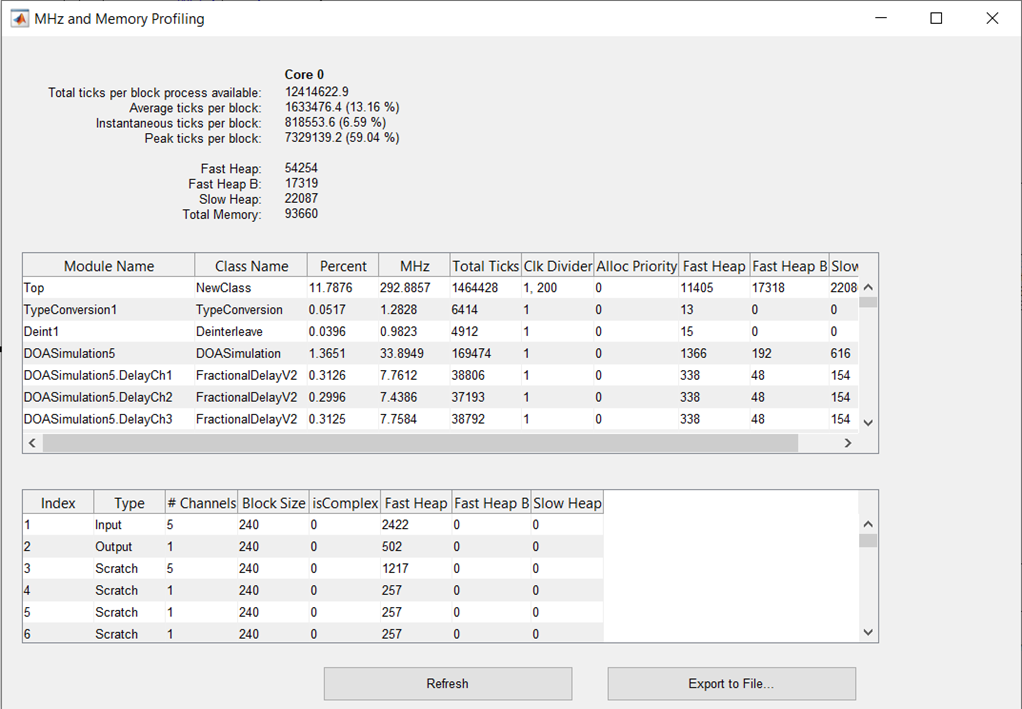
Profile Block by Block Window
In the upper right-hand corner of the profiling window provides the following information:
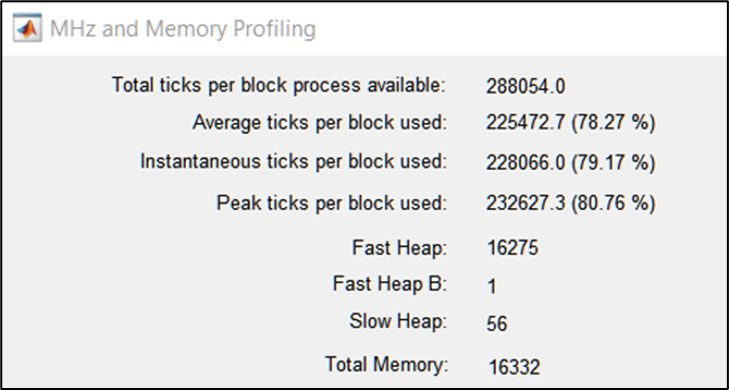
Profile Block by Block Window
Total ticks per block
Average ticks per block
Instantaneous ticks per block
Peak ticks per block
Total memory usage of the system
Profile Block by Block Terminology
The following table describes each field:
Table: Profile Block by Block Terminology
Field | Definition | Unit |
Total ticks per block process available | Measurement from the end of the CPU first interrupt This is an especially important number to check when you are bringing up new hardware. The value shown here should be close to: (Processor Speed) x (Block Size of Processing) / (Sample Rate) If this doesn’t match, then there could be a mismatch in your processor speed, the audio sample rate, or the underlying “fundamental block size” of your implementation. | CPU clock cycles |
Average ticks per block used | Average of CPU clock cycles per block of audio data | CPU clock cycles |
Instantaneous ticks per block used | CPU clock cycles required to process the last block of audio. This is the instantaneous measurement without smoothing. This number will change every time you profile. | CPU clock cycles |
Peak ticks per block used | Peak instantaneous CPU clock cycles consumed when processing a block of audio data. This is a “sticky measurement” and shows the peak value since system startup. If you reprofile, then it will reset this value. | CPU clock cycles |
Fast Heap | Memory usage from the memory allocated in the Fast Heap | Words |
Fast Heap B | Memory usage from the memory allocated in the Fast Heap B | Words |
Slow Heap | Memory usage from the memory allocated in the Slow Heap | Words |
Total Memory | Fast Heap + Fast Heap B + Slow Heap | Words |
Heaps At initialization time, memory to be used by the AWE Core instance for signal processing is allocated. The AWE Core refers to this memory as the heap. By default, AWE Core supports three heaps for which the BSP is responsible for allocating storage. Most commonly, heaps are allocated statically as large arrays. The heaps are:
To calculate Memory in MB: ((Total Heap Memory) * 4)/1000000 | ||
The rest of the profiling window provides profiling information for each individual module and wire (audio buffer) in the running .awd layout:
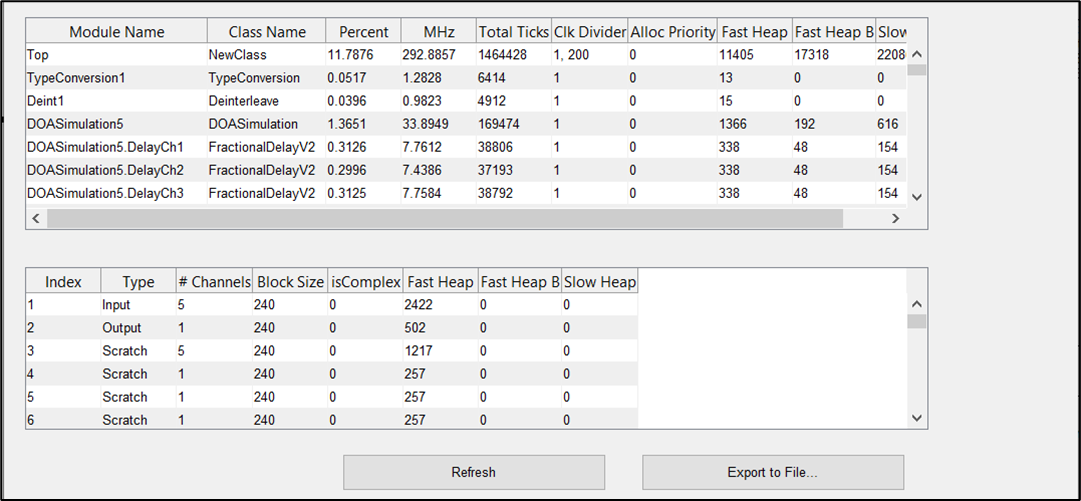
Profile Block by Block Individual Module & Wire Profiling
Note: The ‘Top’ Module Name is profiling information for the entire .awd layout’s processing
Peak Profiling
When selecting the Profile Peak real time profiling option, the Peak Profile Window will pop up:
Profile Peak
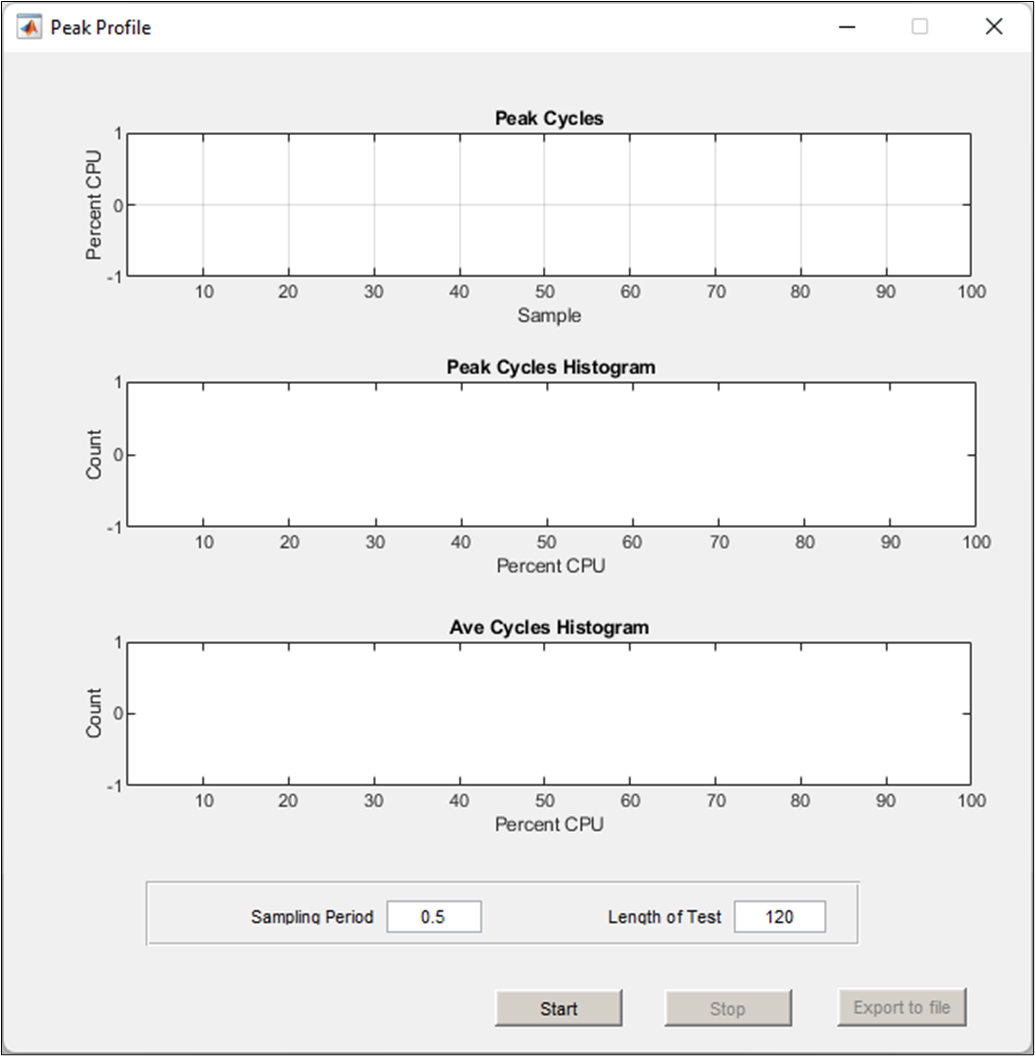
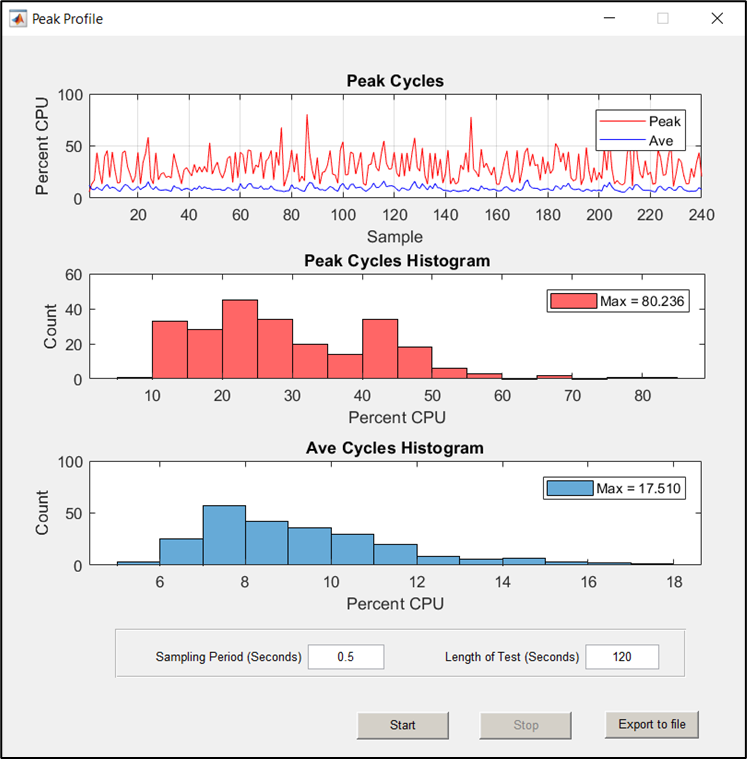
Profile Peak Window
As discussed above, the ‘Sampling Period’ and ‘Length of Test’ fields must be entered in order to run the peak profiling. The time unit for both fields are seconds, and the default values are 0.5s sampling period and 120s length of test. When ready to start the peak profiling, simply click the Start button.
The Peak Profile window will update in real time as the profiling is executed. You can click the Stop button at any time during the profiling if needed, otherwise the peak profiling will complete at the end of the specified length of test.
The ‘Peak Cycles’ graph at the top of the peak profiling window displays peak and average CPU usage percentages of whatever hardware target Audio Weaver is connected to. The x-axis is time in samples and the y-axis is CPU percentage:
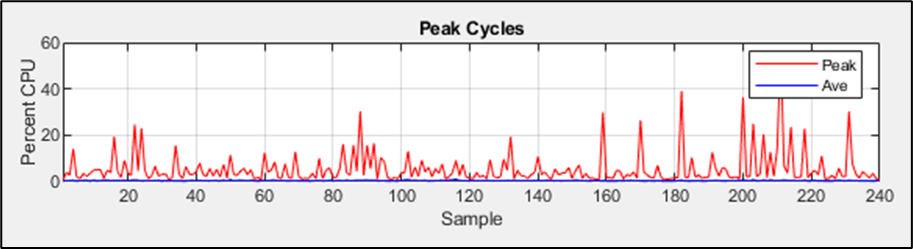
Peak Cycles
The ‘Peak Cycles Histogram’ displays a histogram of the peak cycles profiling shown in the above ‘Peak Cycles’ graph, where the x-axis is CPU percentage, and the y-axis is cycle count:
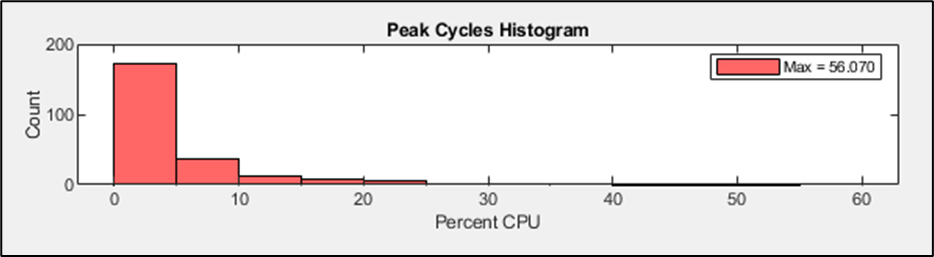
Peak Cycles Histogram
The key in the upper right-hand corner of the histogram shows the maximum peak CPU percentage measured during the peak cycle profiling:
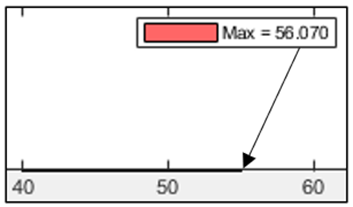
Max Peak CPU Percentage
Lastly, the ‘Ave Cycles Histogram’ displays a histogram of average cycle profiling shown in the above ‘Peak Cycles’ graph, where the x-axis is CPU percentage, and the y-axis is cycle count:
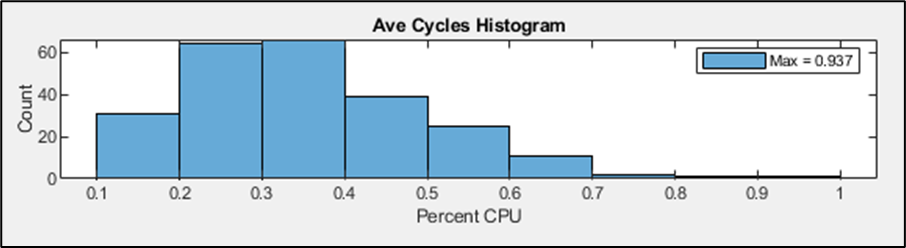
Ave Cycles Histogram
The key in the upper right-hand corner of the histogram shows the maximum average CPU percentage measured during the peak cycle profiling:
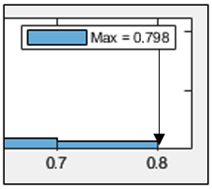
Max Average CPU Percentage
Manual Profiling
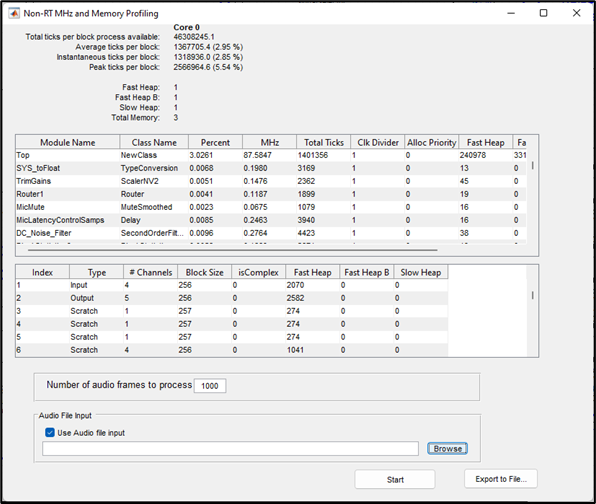
As mentioned earlier in this application note, Audio Weaver also features Manual Profiling, which works in Design Mode (.awd not running). The system profiling resulting from Manual Profiling collects the same information as the real time profiling but adds the option for a user to set the number of iterations to call the layout audio pump (blocks of audio data).
To Manual Profile an .awd layout, navigate to ‘Tools > Manual Profile Layout’ in the Audio Weaver Designer toolbar while in Design Mode:
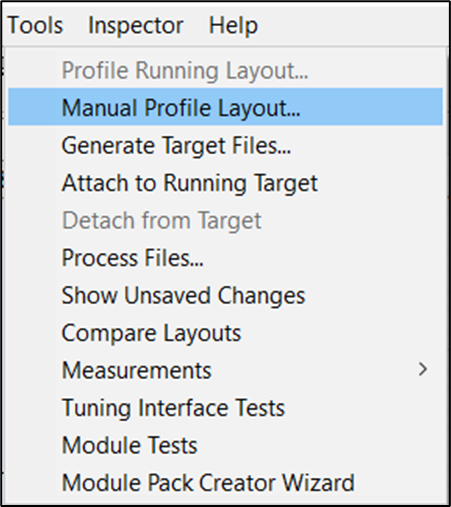
Manual Profile Layout
In the Manual Profile Settings, you can set the number of audio frames/blocks of audio to process and an audio file to be used as input audio data. Manual Profiling also supports .csv exports of the profiling data:
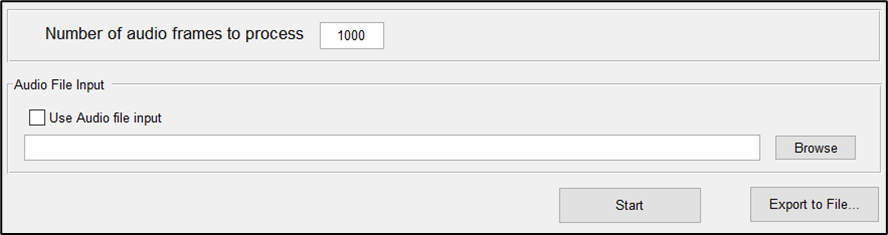
Manual Profile Settings
Exporting Profiling Data to CSV
Both the Real Time and Manual Profiling utilities Audio Weaver allow you to export the profiling data to a comma separated value (.csv) file. All three of the profiling windows (Profile Block by Block, Profile Peak, and Manual Profile Layout) have an ‘Export to File’ Button:

Export to File
Once clicked, you will be prompted to choose a file name and path for the profiling data export. Once exported and saved, you can open the .csv file in Microsoft Excel or equivalent.
The Profile Block by Block and Manual Profile Layout .csv files are structured identically to the pop-up window in Audio Weaver:
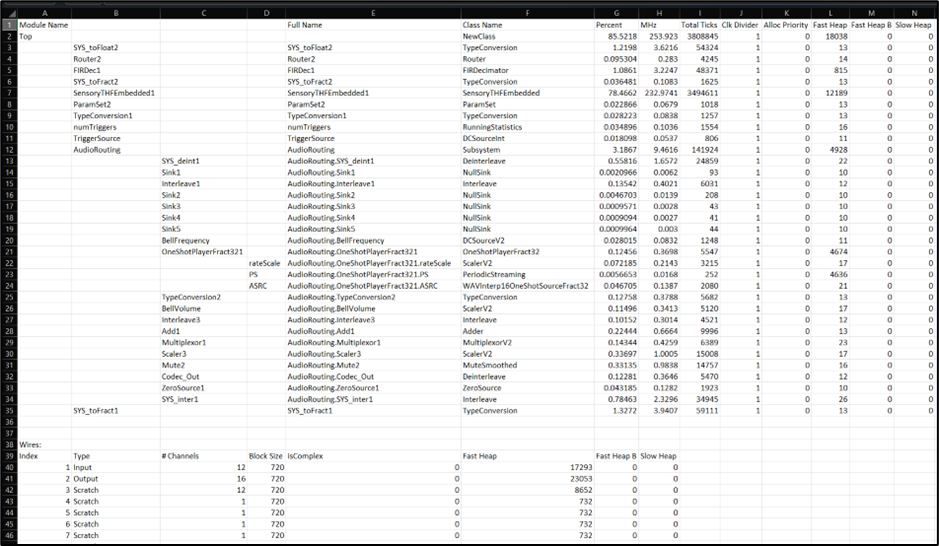
Block by Block Exported CSV
The Profile Peak .csv file is structured as follows, where the Peak and Average Cycle values are indexed by time in seconds:
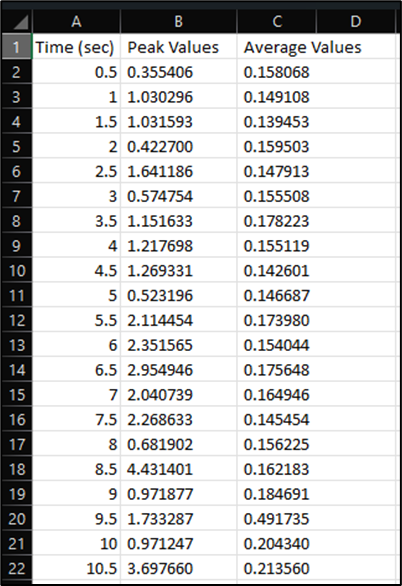
Profile Peak Exported CSV
Profiling Diagrams
Below are some diagrams that further illustrate the real time profiling function in Audio Weaver.
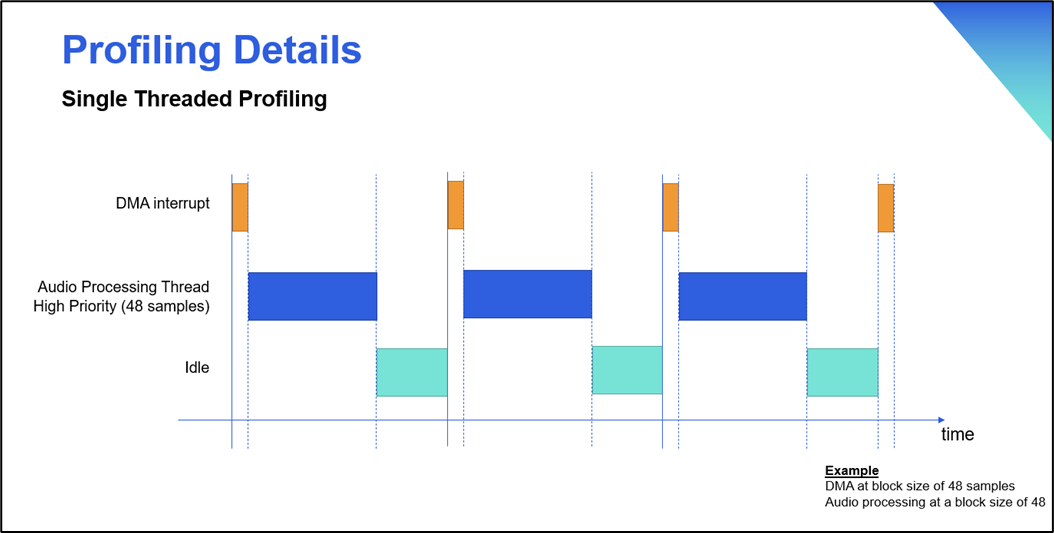
Profiling Details: Single Threaded Profiling
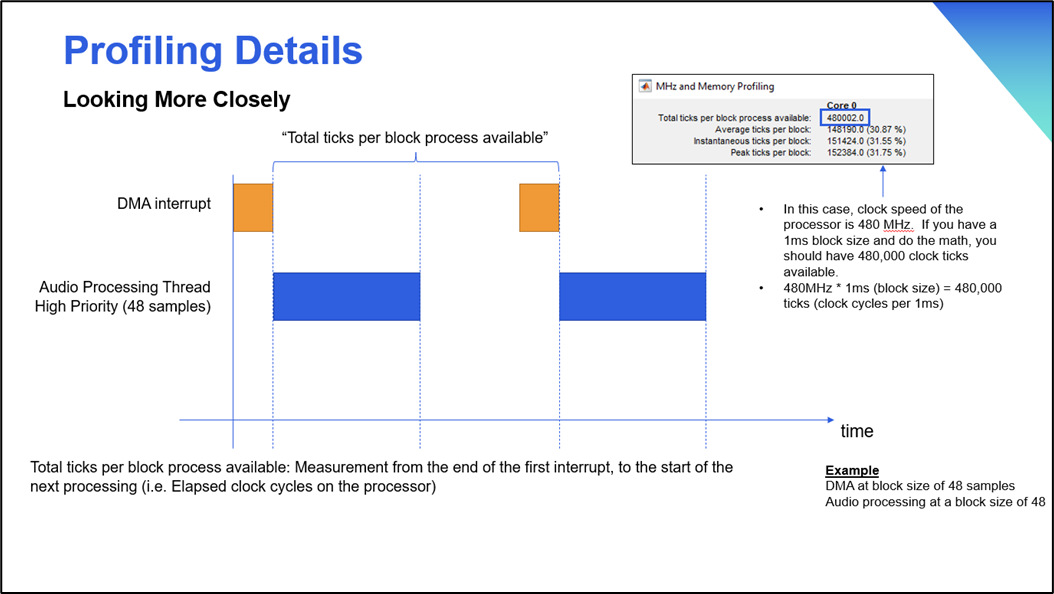
Profiling Details: Total ticks Per Block Process Available
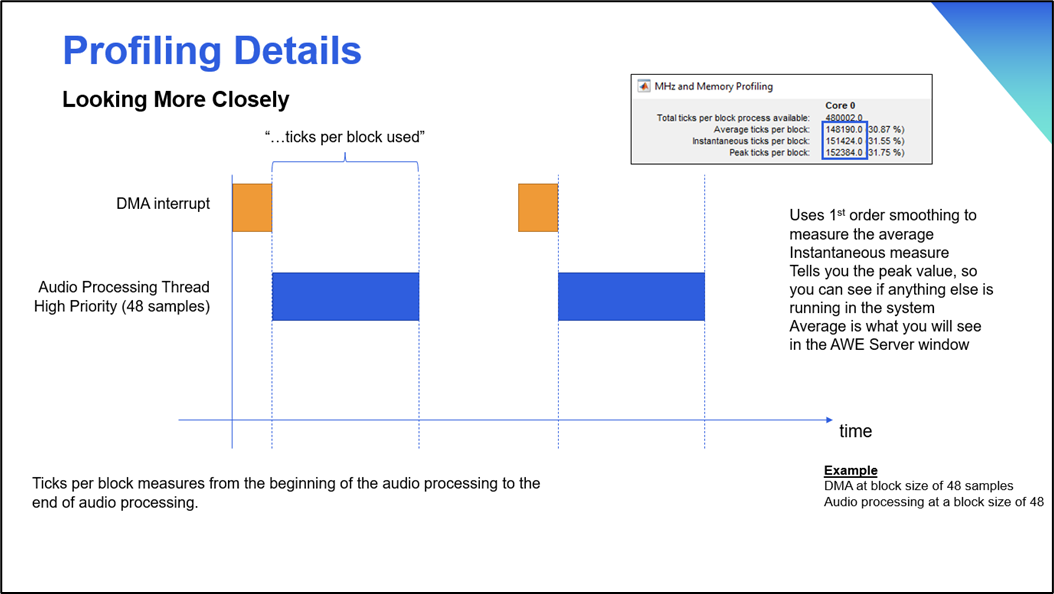
Profiling Details: Ticker Per Block
CycleBurner, BiquadLoading, and FIRLoading Modules
The CycleBurner, BiquadLoading, and FIRLoading Modules intentionally consume processing cycles on the target. They are useful for load and stress testing the target.
CycleBurner Module
The CycleBurner wastes a specified number of clock cycles. You can increase the number of clock cycles used by CycleBurner by adjusting the ‘numCyclesPerBlock’ slider of CycleBurner’s inspector. Using this technique, we can increase the number of cycles until we start to hear distortion in the program material that is being processed by the signal flow.
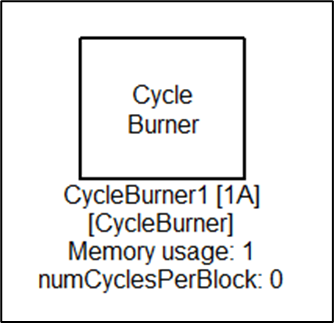
CycleBurner Module
If a higher priority task pre-empts the CycleBurner, then the execution time of the CycleBurner will remain constant. This assumes that the module is pre-empted, and the pre-emption completes before the Cycle Burner completes.
BiquadLoading Module
The BiquadLoading Module simulates the loading of biquad filters. This module is used for CPU load testing purposes and implements a large number of cascade Biquad filters. At instantiation time, you specify the maximum number of filter stages that you would like to simulate. Then at run-time you can vary the number of filters running. This makes the CPU work harder. Internally, the module uses the BiquadCascade module to implement the filtering.
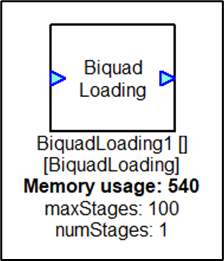
BiquadLoading Module
If the BiquadLoading Module is pre-empted, then the execution time of the modules will be increased.
FIRLoading Module
The FIRLoading Module simulates FIR filter loading. This module is used for CPU load testing purposes and implements a large number of FIR filter taps. At instantiation time, you specify the maximum number of filter taps that you would like to simulate. Then at run-time you can vary the number of filter taps. This makes the CPU work harder since more filter taps are running. Internally, the module uses the FIR module to implement the filtering.
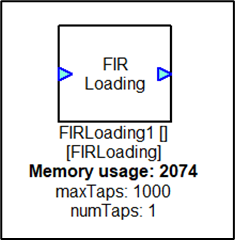
FIRLoading Module
If the FIRLoading Module is pre-empted, then the execution time of the modules will be increased.
Additional Notes on Audio Weaver Profiling
Real time profiling of a multi-threaded layout is not accurate, where the load of a low priority thread can’t be isolated from the high priority thread. Manual profiling on the other hand, does profiling of each thread separately, one after the other and provides accurate information per thread.
Since system and other interrupts can and do preempt audio processing, every measurement has a first order low pass filter to mitigate preemption spikes. The low pass filters are designed so that the time for the profiling values to stabilize is less than 5 seconds. The output of these low pass filters represents the average cycle profiling feature.
In order for profiling to be accurate for embedded targets, AWE Core relies on a suitable operation to retrieve the system cycle count. This operation can be implemented internally in the AWE Core library only if the method supported by the target is known at compile time. If the cycle count retrieve function is not implemented in the AWE Core library, then the user must supply functions that retrieve the system cycle count as part of the application. The core speed and the units of the retrieved cycle counts must be correctly defined by the user for the profiling to be accurate.
The CPU load meter shown on the Server window is accurate for 1 or 2 threads. It is inaccurate for 3 or more threads.
Audio Weaver Server Profiling
While an .awd is running in Audio Weaver, the Audio Weaver Server provides real time CPU and Memory profiling of the entire layout:
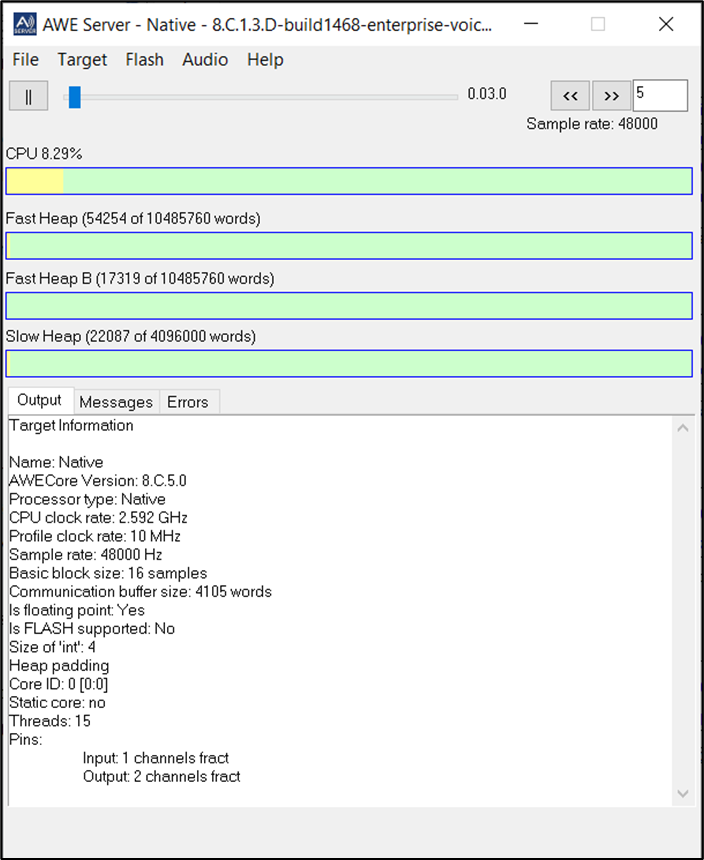
Audio Weaver Server Profiling