Frequency Response Measurements in Audio Weaver
About This Application Note
This document shows you how to use Audio Weaver’s Measurements feature to measure the frequency response of a section of your layout.
Plotting the Frequency Response of a Single Module
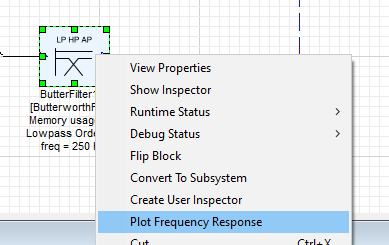
Right-click on the Module in your layout, then select “Plot Frequency Response” (if supported by this module) as shown:
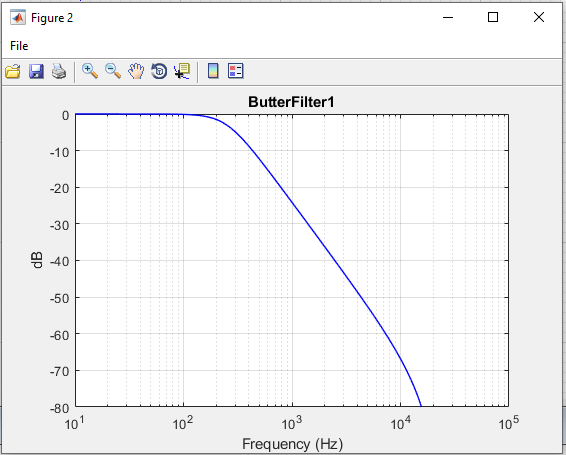
The frequency response of this Module by itself will be displayed:
Using the Measurements feature
If you wish to measure the frequency response between any two points of your layout that include more than a single module between them, use the measurements feature. The following example demonstrates the procedure, although with a single module for the sake of clarity.
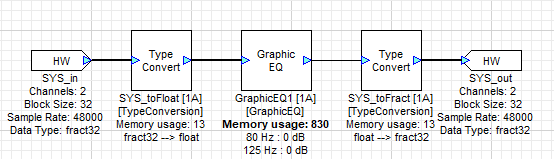
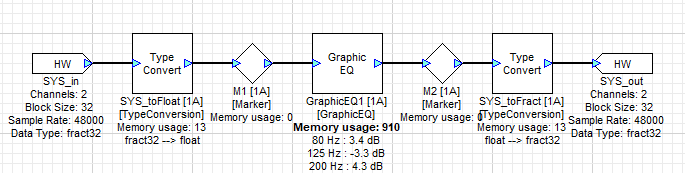
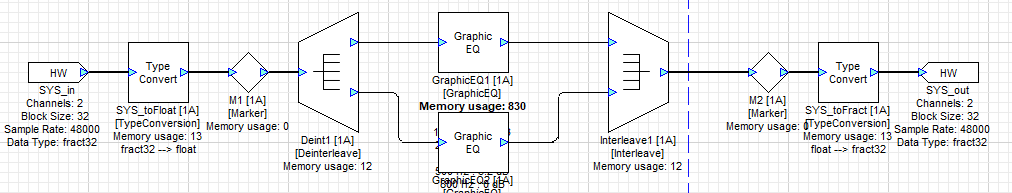
Let’s suppose you have just made a layout which uses the GraphicEQ module and you wish to double check its frequency response for different settings.
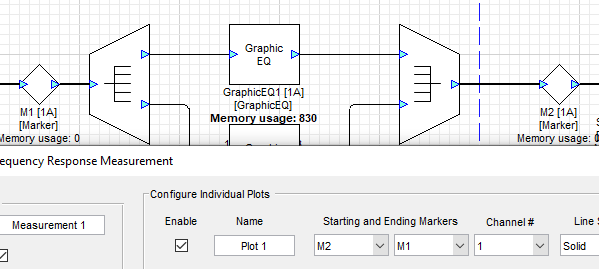
Add two marker modules in line with the input and output pins of the GraphicEQ module as shown.
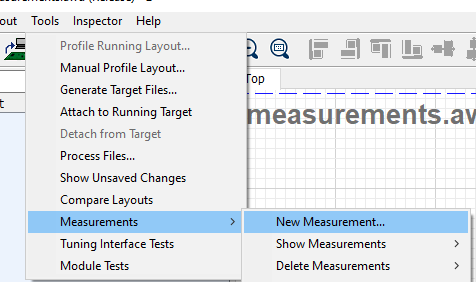
Select “Tools->Measurements->New Measurement”.
Configure Frequency Response Measurement Dialog
When you create a new Measurement, the “Configure Frequency Response Measurement” Dialog is opened automatically.
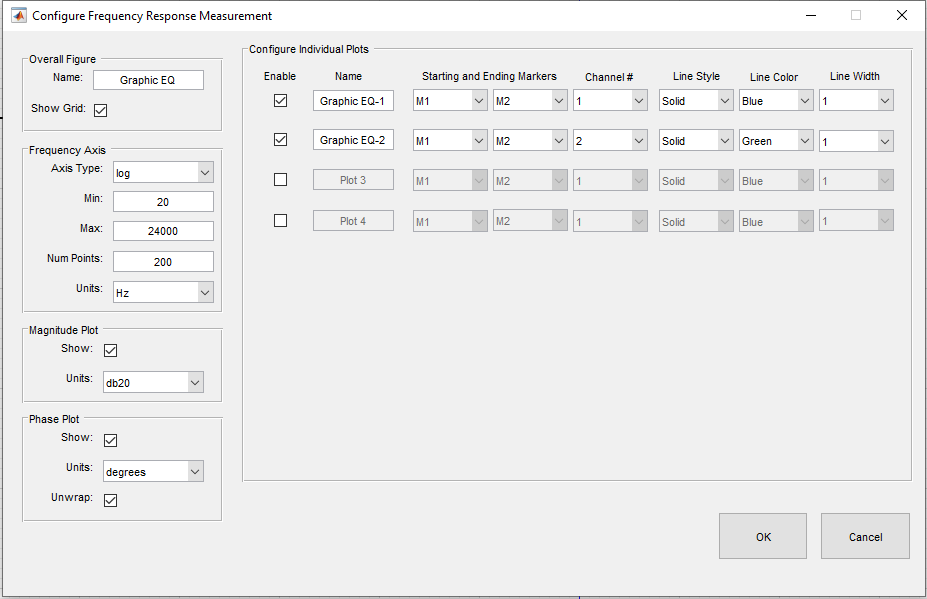
Overall Figure
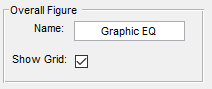
Give this Measurement a memorable name and select whether or not to show the grid.
Frequency Axis
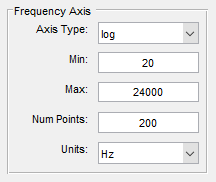
Axis Type: log or linear
Min: Minimum value
Max: maximum value
Num Points: how many points to plot
Units: Hz, Normalized, or radians/sample.
Magnitude Plot
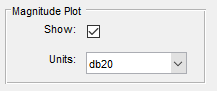
Show: enable or disable the magnitude plot
Units: db20 or linear
Phase Plot
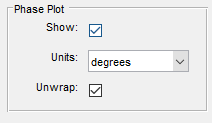
Show: enable or disable the phase plot
Units: degrees or radians
Unwrap - when enabled, shows phase as continuously increasing beyond 360 degrees (2* pi radians). If not enabled, the phase display will wrap around if it goes above 360 degrees.
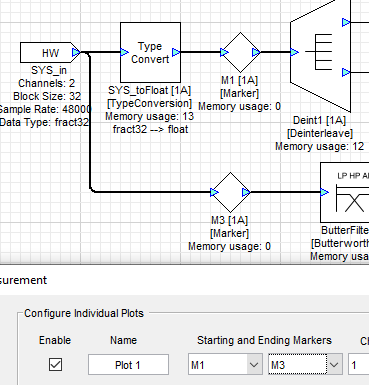
In the “Configure Individual Plots” dialog, select the Starting and Ending markers from the drop-down boxes. If the selected wire has more than one channel, you will need to select an individual channel as shown.
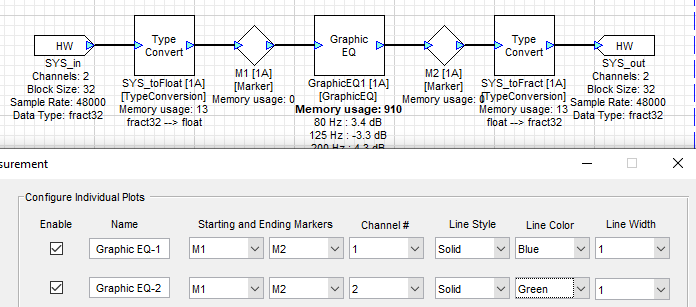
Configure Individual Plots
You can enter or choose the following options for individual plots:
Enable - checkbox allows you to quickly turn a defined plot on and off
Name - enter a name for your plot to help remember what it means
Starting Marker - the reference point in the layout for the frequency response.
Ending Marker - the measurement point in the layout for the frequency response.
Channel # - only one signal can be shown in a plot. If the wire has multiple channels, you’ll have to pick one.
Line style - Solid, Dotted, Dash Dot, Dashed
Color - Blue, Green, Red, Cyan, Magenta, Yellow, Black
Click on “OK” to save your Measurement.
The Measurement Panel
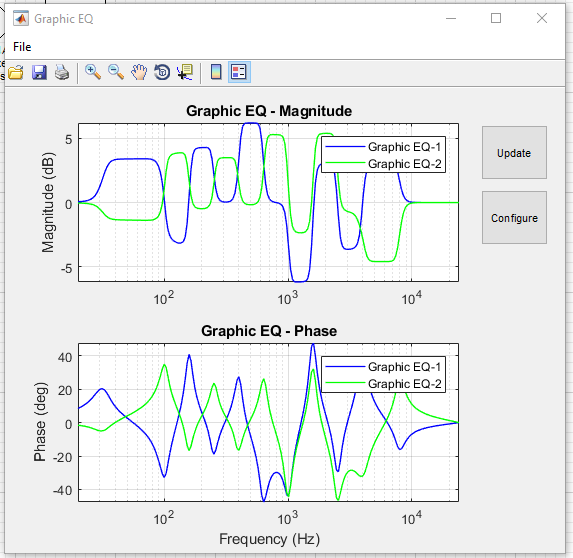
The Measurement panel opens up and displays your selected measurements.
Update - the Measurement will not update automatically when you make changes to your layout. Click this button to update the Measurement plot. The measurement can be taken whether or not your layout is running.
Configure - opens the “Configure Frequency Response Measurement” dialog.
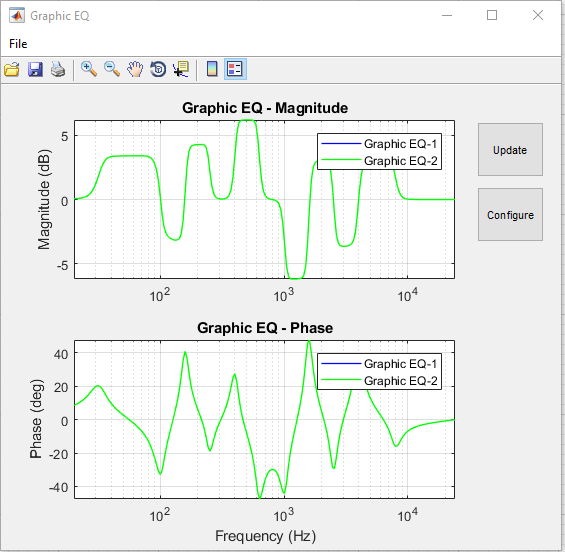
In this example, since the processing in the left and right channels is identical, you only see one trace (as they are drawn on top of each other). The next example uses individual GraphicEQ modules in the left and right channels, so you can see the individual response curves.
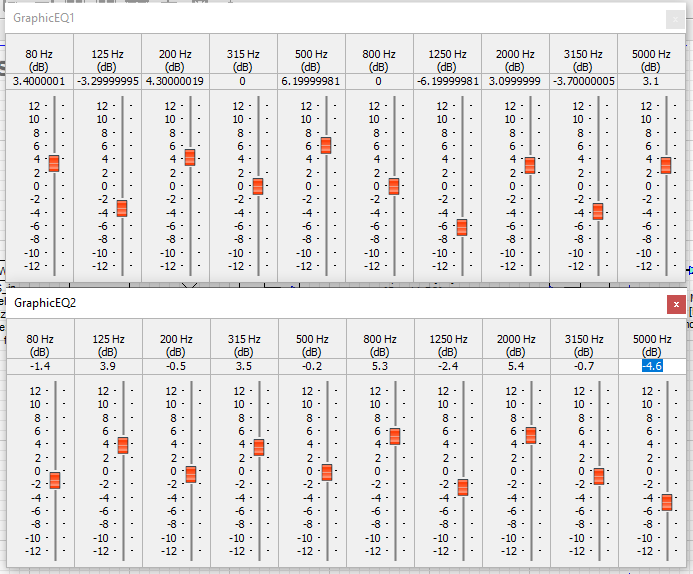
Settings for modules GraphicEQ1 and GraphicEQ2.
Managing Measurements
Once you create a Measurement, it can be accessed from the “Tools->Measurements->Show Measurements” menu.
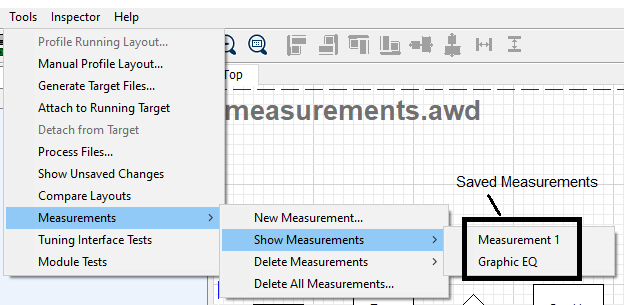
The “Tools->Measurements” menu also allows you to delete an individual Measurement or all Measurements in your layout.
Behind the scenes
Each module supports a “Frequency response plot” function that is separate from the DSP processing code. When you create a Measurement, each individual plot line is defined as being the frequency response between two Markers. In order to generate the frequency response, the function iterates through the chain of modules, starting at the first one. The frequency response points are calculated (in dB) according to the settings you entered for the “Frequency Axis”. As you move through the chain of modules, the frequency response values are added together.
If the Magnitude Plot is set to “db20”, then this totalled value for each frequency point is plotted.
If the Magnitude Plot is set to “linear”, then this totalled value for each frequency point is converted to its linear value and then plotted.
Limitations of the Measurement Feature
Modules with Control Pin Inputs
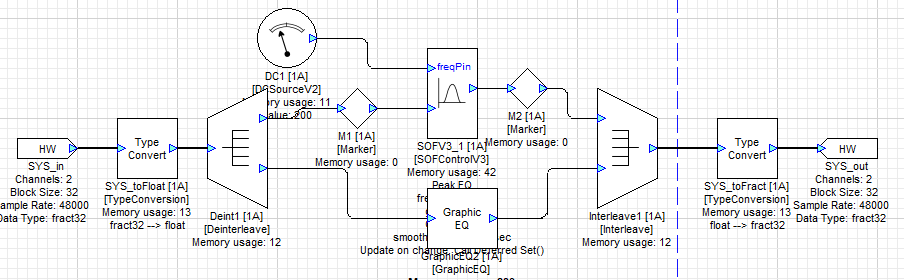
If the signal path whose frequency response you wish to measure includes any blocks with Control Pin inputs, such as the “freqPin” input on the SOFControlV3 filter module, you may see an error message and the Measurement will fail. The specific error depends on the layout and may not point directly at the problem.
This layout:
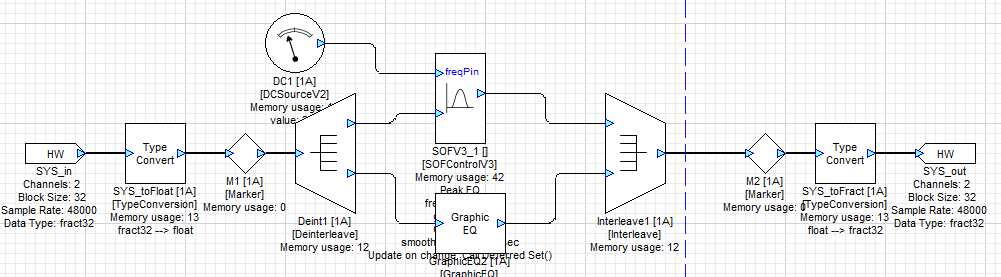
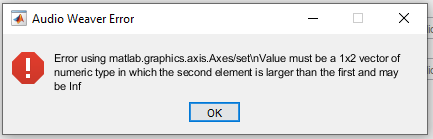
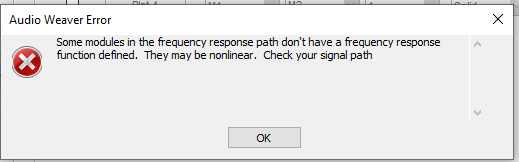
generates this error:
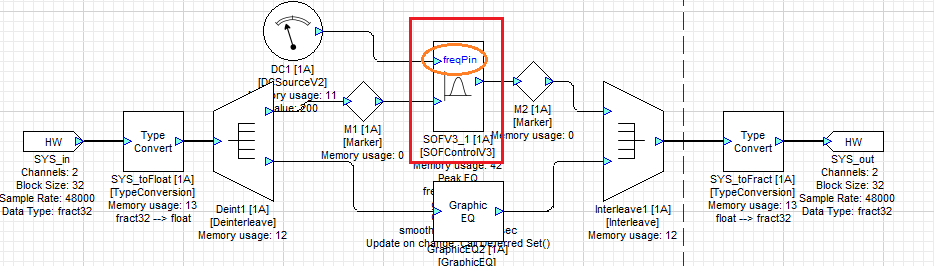
This very similar layout:
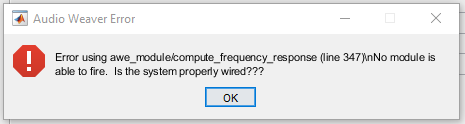
generates this error:
In both cases, the cause is the controllable filter module:
Selected markers do not have a valid signal path between them
If you pick the wrong markers, such that the Ending marker is not downstream from the starting marker, you will see this error message:
Here’s one such possibility:
Similarly, swapping the Ending and Starting markers on a valid path will also fail: