
Using the CrossoverFilter Module
About This Guide
This document contains instructions for using the CrossoverFilter module. This module lets you easily break your audio signal into multiple frequency bands which can be individually processed, and/or sent to individual speaker drivers optimized to work in that frequency range.
Common applications for the CrossoverFilter include:
Speaker crossovers
Multi-band dynamics processing
CrossoverFilter example
The CrossoverFilter example CrossoverExample1.awd does not pass system audio through the crossover. Rather, the system audio merely passes through the input to the output. The CrossoverFilter is fed with a sine wave to more clearly demonstrate the operational characteristics of the two filter modes.
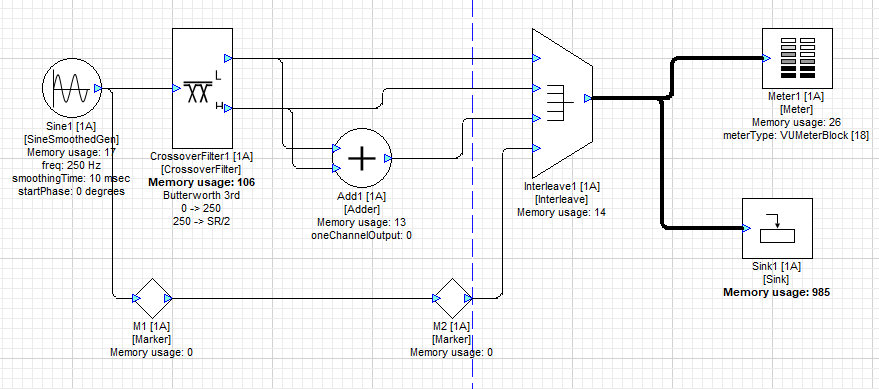
Figure 1.
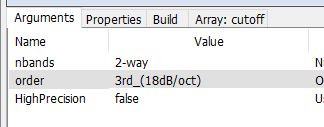
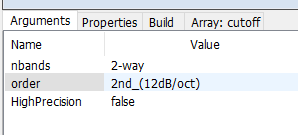
Look at the Properties view of CrossoverFilter1.
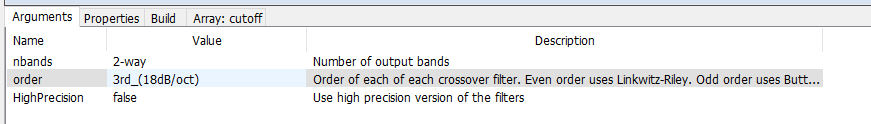
nbands: how many bands to split the audio spectrum into. Valid range is 2-way through 12-way.
order: the order of the filter. The higher the order, the sharper the transitions are between adjacent bands, at the expense of additional CPU load. In addition, odd and even-order filters behave slightly differently, as we will show below. Valid order range is 2nd through 10th, which corresponds to transitions of 12 dB/octave to 60 dB/octave.
HighPrecision: use a High Precision version of the filter for super-accurate settings, at the expense of increased CPU load.
Odd-order: Butterworth
When you select an even order filter, the response will be what is known as Butterworth, often referred to as “maximally flat”. Note that while odd-order Butterworth filters are possible, they are not used in the CrossoverFilter module.
Note in the example patch that we split the signal into 2 bands at 250 Hz, and are initially using a 250 Hz sine wave as a test signal. The signals that we will look at are:
The low band
The high band
The sum of the low and high band
The original signal
For this example, set the Properties as shown:
Now run the patch.
Levels
Click on Meter1 and Sink1 to open these panels.
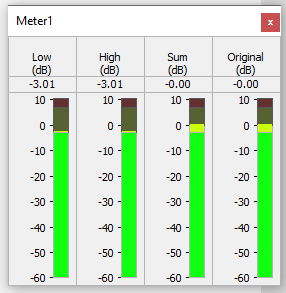
The level meter shows that the level of each individual output signal at the crossover frequency is -3 dB. The sum of the two bands matches the original level at 0 dB. These relationships hold for higher odd orders as well.
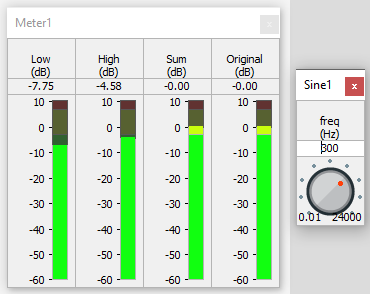
Change the frequency of Sine1 to 200 Hz.
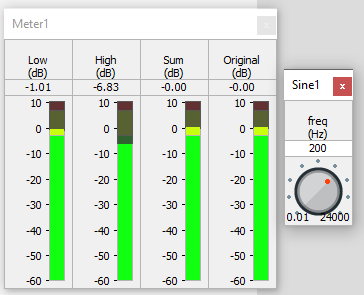
Note that the low level has increased, the high level has decreased, yet the sum stays the same. A similar result is seen with the source signal above the crossover frequency.
Phase relationships
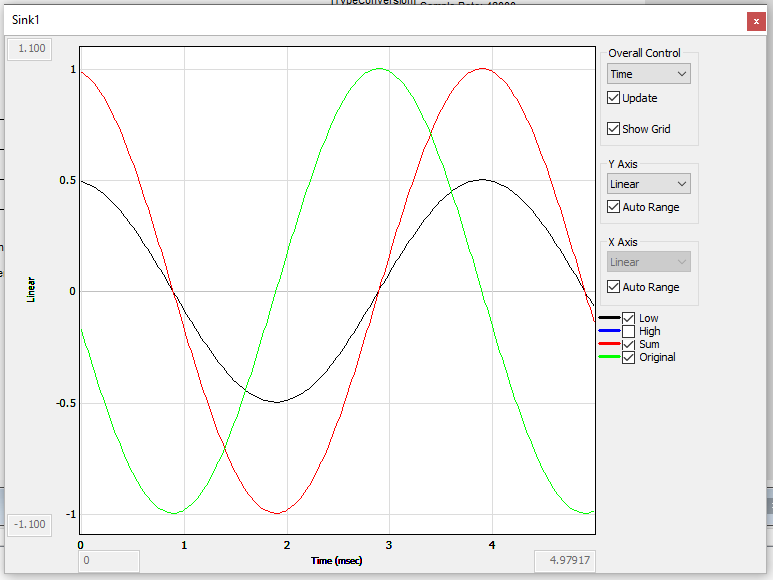
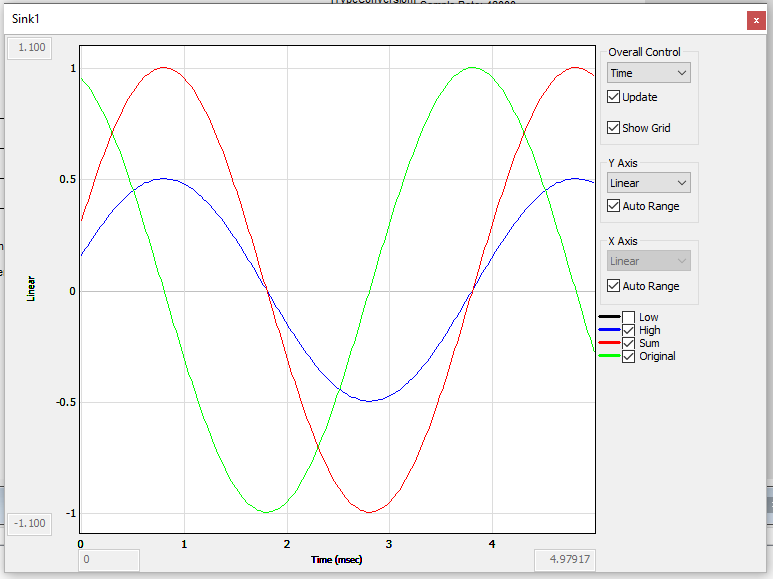
The phase relationships between the various signals can be seen by running the program and opening Sink1. The test signal is 250 Hz here.
This time around, no two signals are in phase so we can see all of them at once.
High and Low have a peak value of 0.707.
The point where Low and High add together to form the peak of the Sum signal is not at the peak of either the Low or the High signal.
If these signals were sent to a 2-way speaker through identical amplifiers, the motion of the low driver would be 90 degrees out of phase with the motion of the high frequency driver at the crossover frequency.
Original and Sum have the same level but are 180 degrees out of phase.
The summed power of the High and Low outputs is +3 dB at the crossover frequency.
Even-order: Linkwitz-Riley
When you select an even order filter, the response will be what is known as Linkwitz-Riley, a very common filter response for crossovers. The definition of a Linkwitz-Riley filter involves cascading two Butterworth filters at the same cutoff frequency. This results in the amplitude being -6 dB compared to the passband. The actual corner frequency (-3 dB point) is lower (for a lowpass) than the design frequency where the response is -6 dB.
Note in the example patch that we split the signal into 2 bands at 250 Hz, and are initially using a 250 Hz sine wave as a test signal. The signals that we will look at are:
The low band
The high band
The sum of the low and high band
The original signal
For this example, set the Properties as shown:
Now run the patch.
Levels
Click on Meter1 and Sink1 to open these panels.
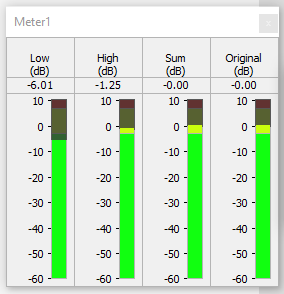
The level meter shows that the level of each individual output signal at the crossover frequency is -6 dB. The sum of the two bands matches the original level at 0 dB. These relationships hold for higher even orders as well.
Change the frequency of Sine1 to 200 Hz.
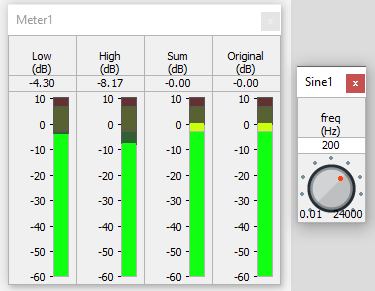
Note that the low level has increased, the high level has decreased, yet the sum stays the same. A similar result is seen with the source signal above the crossover frequency.
Phase relationships
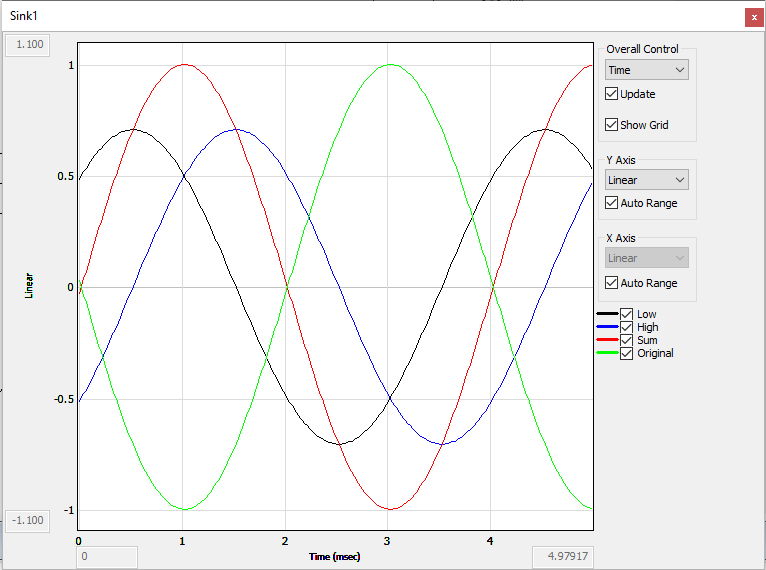
The phase relationships between the various signals can be seen by running the program and opening Sink1. The test signal is 250 Hz here.
The first image shows Low, Sum, and Original.
Low and Sum are in phase.
Original and Sum have the same level but are 90 degrees out of phase.
The next image shows High, Sum, and Original.
High and Sum are in phase.
Original and Sum have the same level but are 90 degrees out of phase
High and Low have the same phase and amplitude, which is why we looked at them individually. Otherwise, one of the traces disappears.
With these two images taken together, we conclude, that at the crossover frequency:
High, Low, and Sum are in phase.
High and Low have the same amplitude, 0.5.
Original and Sum have the same amplitude but are 90 degrees out of phase.
The summed power of the High and Low outputs is +0 dB at the crossover frequency.
Summary
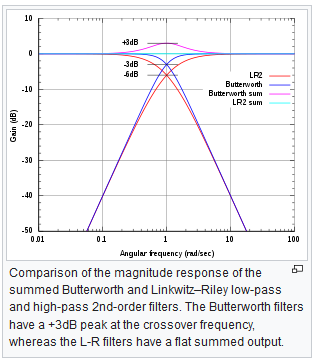
The table below summarizes the differences between the two filter types.
Both filter types give a flat frequency response across bands when summed together (voltages)
The Butterworth based crossover exhibits a +3 dB bump at the crossover frequency when the power of the output signals is added together.
The Linkwitz-Riley’s frequency response across bands is flat when the power of the output signals is added together.
Order | Crossover Type | Adjacent Band Phase at crossover frequency | Adjacent band level at crossover frequency | Response at crossover frequency |
Even | Linkwitz-Riley | In phase | -6 dB | 0 db (flat) |
Odd | Butterworth | 90 degrees out of phase | -3 dB | + 3 dB |
References
https://en.wikipedia.org/wiki/Linkwitz%E2%80%93Riley_filter
Appendix style will auto-number alpha
Table Header | ||||
Table contents |