
Profiling in Audio Weaver: Tips and Tricks
About This Application Note
This ‘Profiling in Audio Weaver’ application note contains instructions for computational and memory profiling of and Audio Weaver Designer (.awd) signal flow in Audio Weaver. The profiling works in real time on a running .awd layout (Figure 1) for both Native (PC) and on embedded targets.
Real-Time Block by Block Profiling
This profiling happens while the audio processing is running in real-time. Additionally, there is a manual audio pump feature which does similar profiling but operates in non-real-time.
Manual Profiling
Real Time Profiling
In Audio Weaver, Design Mode refers to a non-running .awd, while Tuning Mode refers to a running .awd layout. You can enter Tuning Mode by clicking the run button in Audio Weaver Designer:

While an .awd is in Tuning Mode (running), the entire layout can be profiled in real time. Profiling a running .awd will yield the following information:
Overall memory usage and cycle consumption of the complete audio system signal flow
Overall memory usage and cycle consumption of each Audio Weaver instance for multi-instance architectures
For more information about Audio Weaver’s multi-instance architectures, please see this Application Note:
Memory usage and cycle consumption of each individual module in the audio system signal flow
Memory usage and cycle consumption of each individual module per Audio Weaver instance for multi-instance architectures in the audio system signal flow
Memory usage of all the wires (audio buffers) in the audio system signal flow
Memory usage of shared heap memory for multi-instance architectures
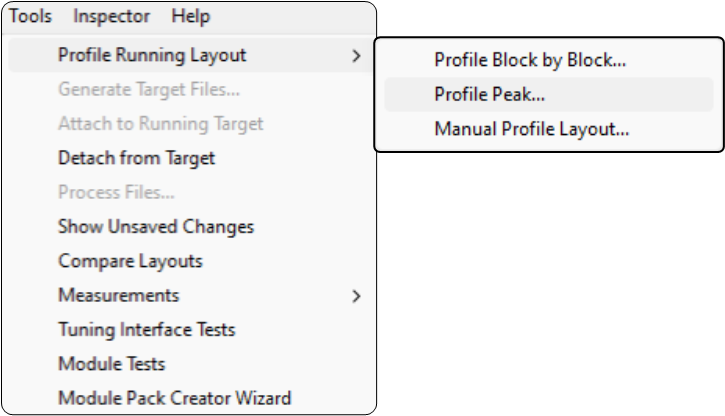
To profile a running .awd in real time, navigate to the ‘Tools > Profiling Running Layout’ menu in the Audio Weaver Designer toolbar while in Tuning Mode:
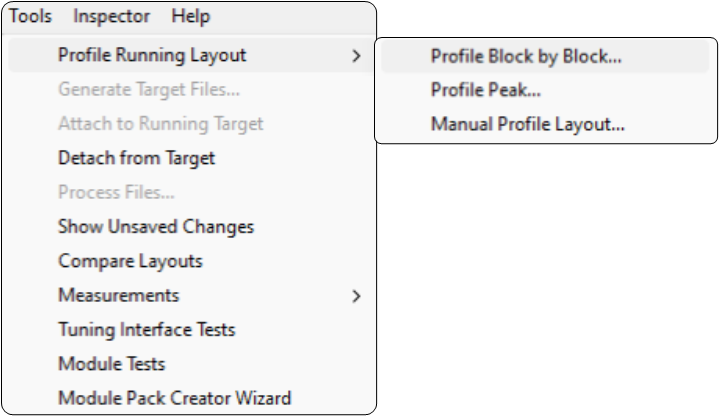
Profile Running Layout
There are two options for profiling a running .awd layout in real time:
Profile Block by Block
Profile Peak
The ‘Block by Block’ profiling will provide information MHz and Memory consumption of each individual element of the .awd at the time of the profiling, while ‘Peak’ profiling will provide information about average and peak CPU cycle usage over a user-specified time.
Block by Block Processing

Peak Profiling
Selecting ‘Profile Block by Block’ will automatically run profiling on the entire running .awd layout at the time of selection, while ‘Profile Peak’ is manually started once the desired ‘Sampling Period’ and ‘Test Length” fields are set:
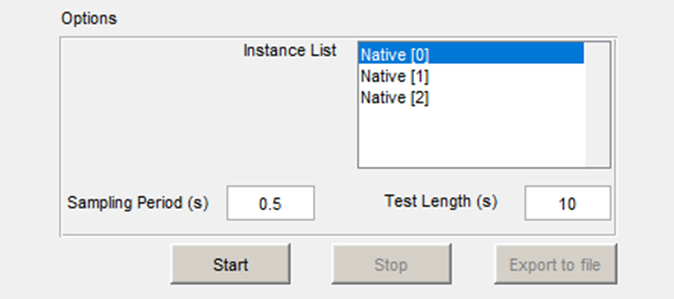
Peak Profiling Sampling Period & Length of Test
Understanding Real Time Profiling Information
Block by Block Profiling
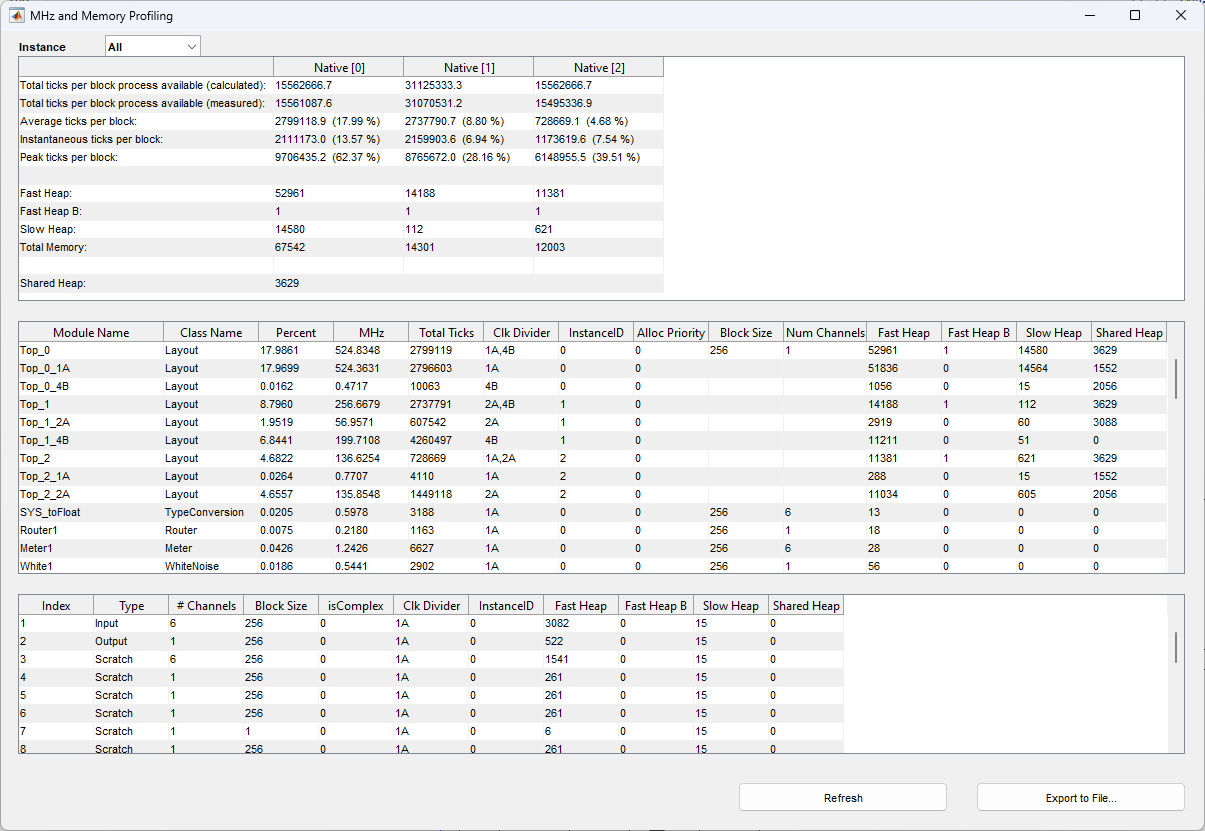
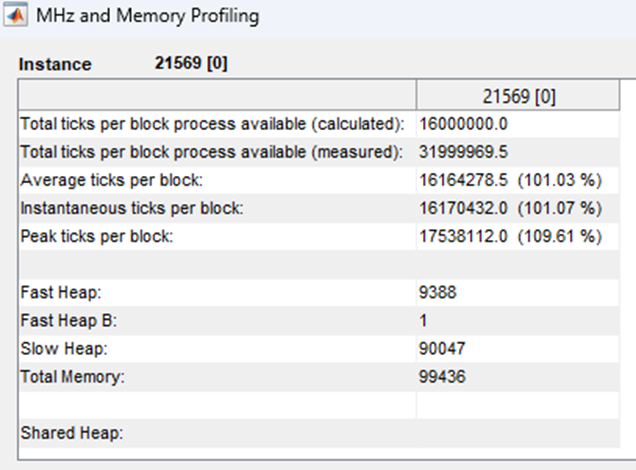
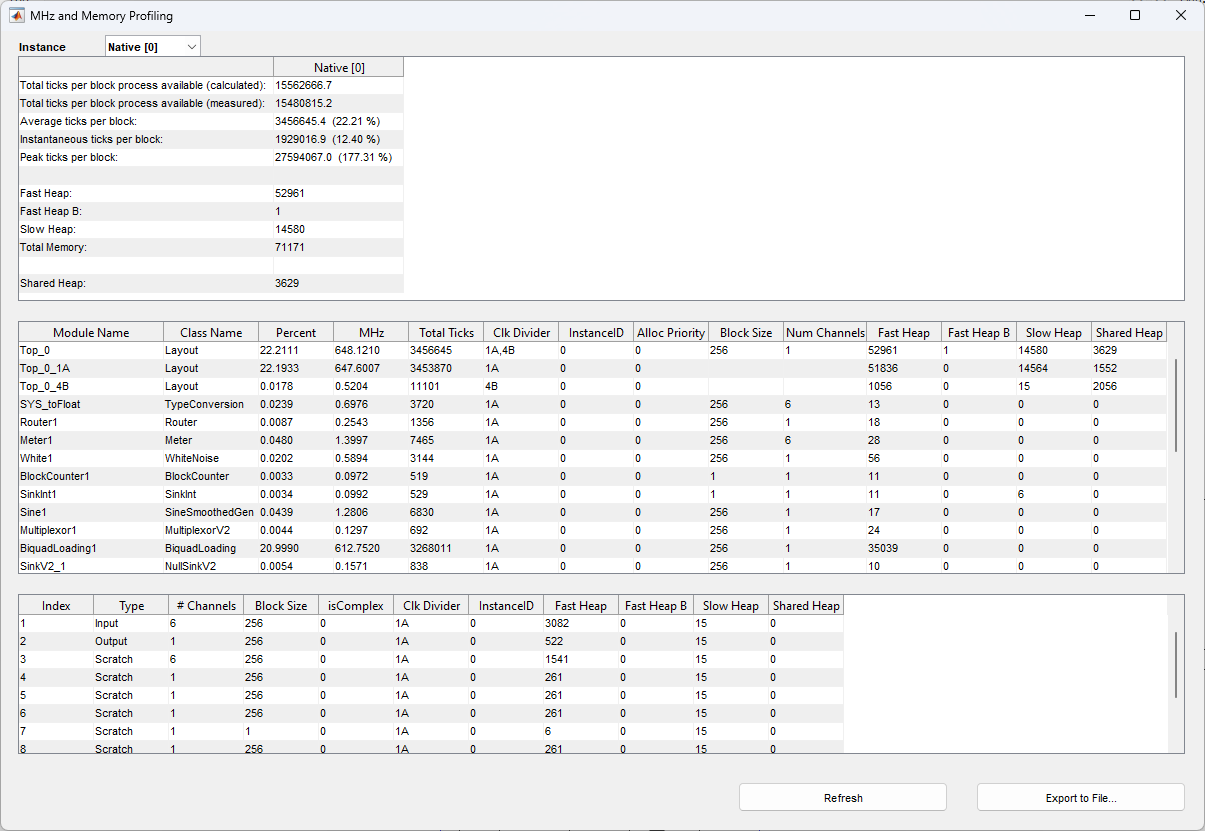
When selecting the ‘Profile Block by Block’ real time profiling option, Audio Weaver will run complete MHz and Memory profiling on the entire audio system signal flow (.awd) and display the profiling information in a pop-up window. The ‘Tick’ mentioned here is the time measured in terms of CPU clock cycles. It can be measured as Tick = (1/CPU Clock Frequency). MHz is the Million Instructions Per Second (MIPS) of the system.
Profile Block by Block Window
In the upper right-hand corner of the profiling window provides the following information:
Total ticks per block process available (calculated and measured)
Average ticks per block
Instantaneous ticks per block
Peak ticks per block
Total memory usage of the system
Shared heap memory for multi-instance architectures
Profile Block by Block Window (intentional CPU overflow)
Profile Block by Block Terminology
The following table describes each field:
Field | Definition | Unit |
Total ticks per block process available | Measurement from the end of the CPU first interrupt This is an especially important number to check when you are bringing up new hardware. The value shown here should be close to: (Processor Speed) x (Block Size of Processing) / (Sample Rate) If this doesn’t match, then there could be a mismatch in your processor speed, the audio sample rate, or the underlying “fundamental block size” of your implementation. Lastly, there are two separate line items for ‘Total ticks per block process available’.
Both of these units should nearly match, however be aware that if there are CPU overflows (>100% processing load), the ‘Measured’ metric will be doubled. In this scenario, since the audio pump is not completed during the current block of processing, the measured metric would include the next block as well. | CPU clock cycles |
Average ticks per block used | Average of CPU clock cycles per block of audio data | CPU clock cycles |
Instantaneous ticks per block used | CPU clock cycles required to process the last block of audio. This is the instantaneous measurement without smoothing. This number will change every time you profile. | CPU clock cycles |
Peak ticks per block used | Peak instantaneous CPU clock cycles consumed when processing a block of audio data. This is a “sticky measurement” and shows the peak value since system startup. If you reprofile, then it will reset this value. | CPU clock cycles |
Fast Heap | Memory usage from the memory allocated in the Fast Heap | Words |
Fast Heap B | Memory usage from the memory allocated in the Fast Heap B | Words |
Slow Heap | Memory usage from the memory allocated in the Slow Heap | Words |
Total Memory | Fast Heap + Fast Heap B + Slow Heap | Words |
Shared Heap | Memory usage from the allocated Shared Heap | Words |
Heaps At initialization time, memory to be used by the AWE Core instance for signal processing is allocated. The AWE Core refers to this memory as the heap. By default, AWE Core supports three heaps for which the BSP is responsible for allocating storage. Most commonly, heaps are allocated statically as large arrays. The heaps are:
To calculate Memory in MB: ((Total Heap Memory) * 4)/1000000 | ||
The rest of the profiling window provides profiling information for each individual module and wire (audio buffer) in the running .awd layout:
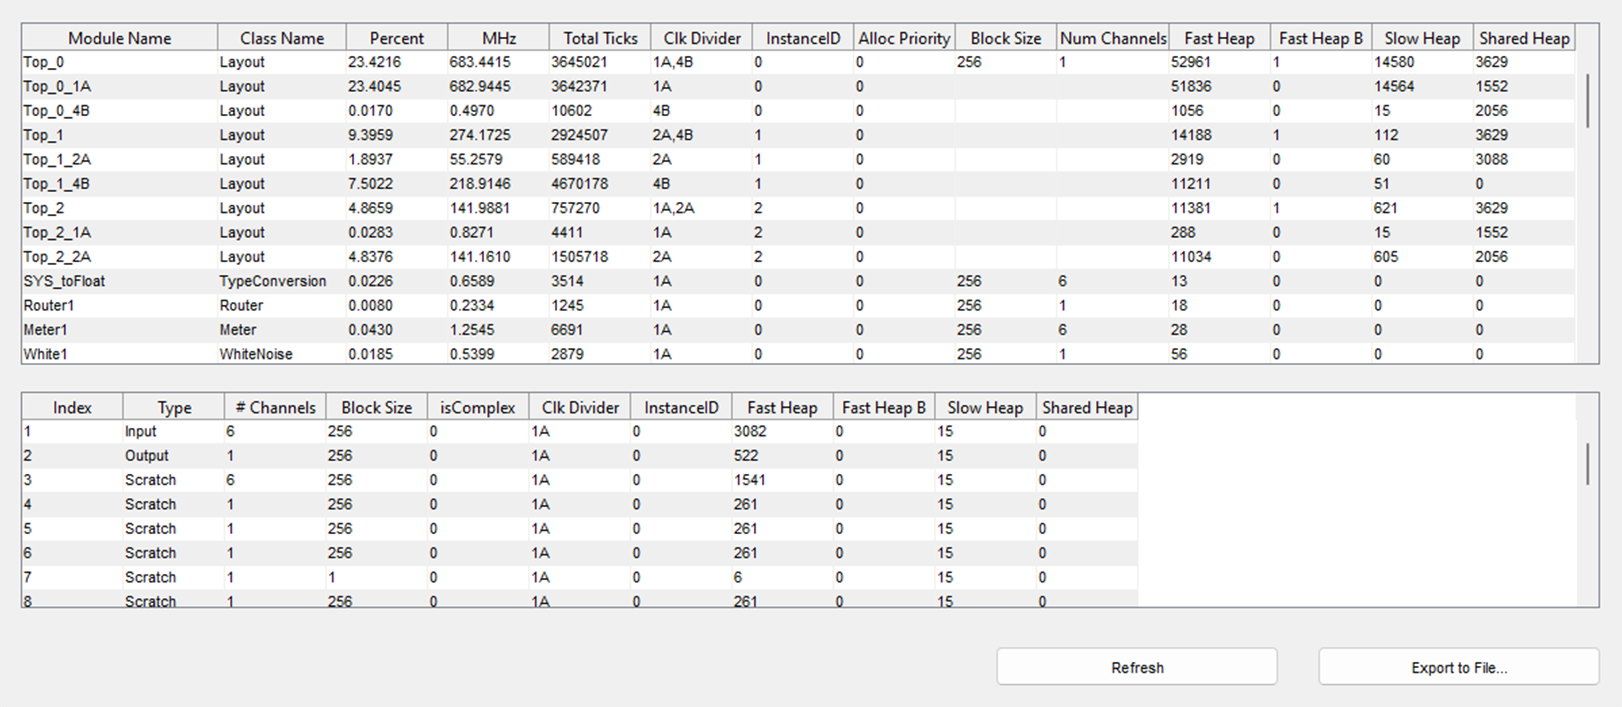
Profile Block by Block Individual Module & Wire Profiling (All Audio Weaver Instances)
Field | Description |
|---|---|
Module Name | Name of the specific module in this layout. |
Class Name | Class to which the module belongs. |
Percent | Percent of the CPU load taken by this module or subsystem. |
MHz | Percent times the Total ticks per block process available. |
Total Ticks | Number of clock ticks which were measured for this module. |
Clk Divider | Clock dividers assigned in this module or subsystem. |
InstanceID | Assigned Instance ID |
Alloc Priority | Assigned allocation priority |
Block Size | Module’s block size |
Num Channels | Number of channels |
Fast Heap | Allocation to Fast Heap |
Fast Heap B | Allocation to Fast Heap B |
Slow Heap | Allocation to Slow Heap |
Shared Heap | Allocation to Shared Heap |
The ‘Top_0’ Module Name line item contains profiling information for the entire .awd layout’s processing. In a multi-instance architecture, aggregate profiling information for each discrete Audio Weaver instance is labeled as ‘Top_<AWE Instance #>’. If the .awd utilizes multiple audio processing threads, aggregate profiling information for each discrete thread is labeled as ‘Top_<AWE Instance #>_<Thread ID>’:
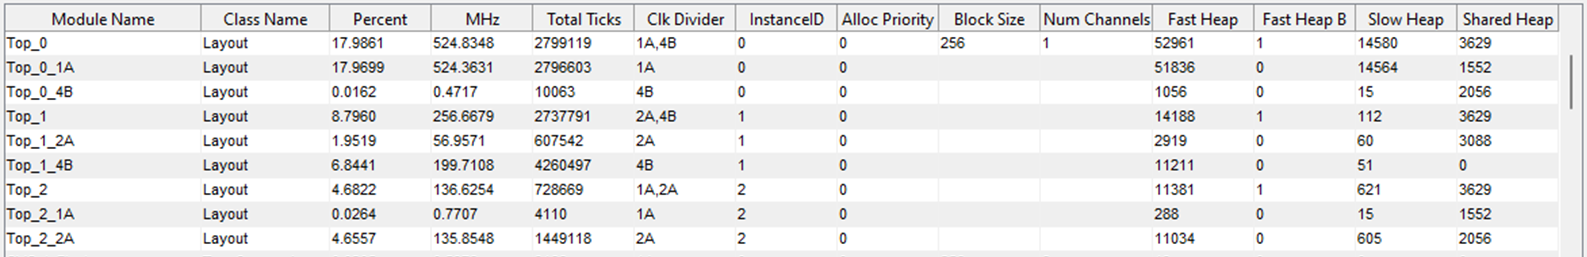
Top Profiling for AWE Instances and Threads
For more information on multi-threading in Audio Weaver, see the Threading and Clock Dividers Application Note.
In a multi-instance architecture, by default the profiling pop-up window displays profiling information for all of the Audio Weaver instances used:

Block by Block Processing: All AWE Instances
To display profiling information for only one specific Audio Weaver instance, you can do so by selecting the desired Audio Weaver instance from the Instance drop down menu in the upper left-hand corner:
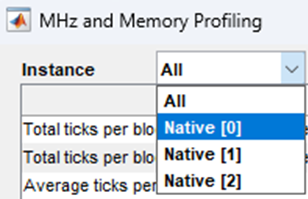
Block by Block Profiling: AWE Instance Selection
Block by Block Profiling – Discrete AWE Instance
Peak Profiling
When selecting the Profile Peak real time profiling option, the Peak Profile Window will pop up:
Profile Peak
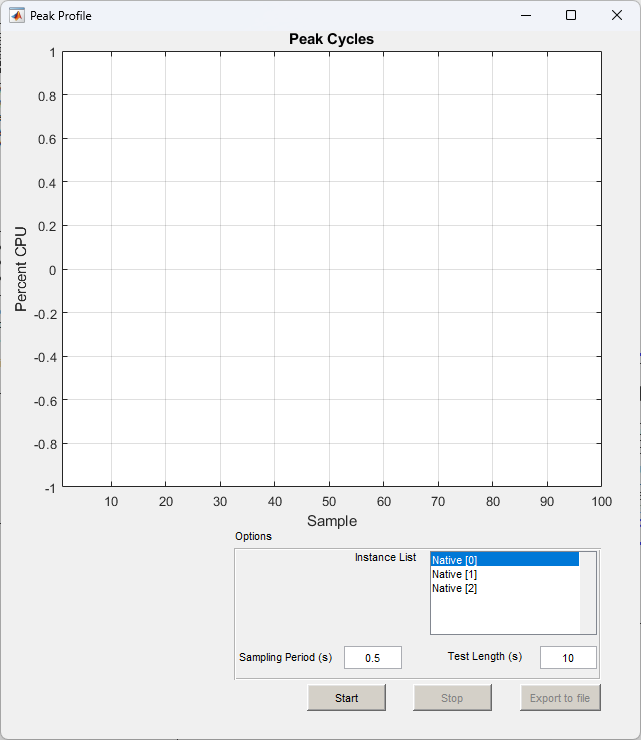
Profile Peak Window
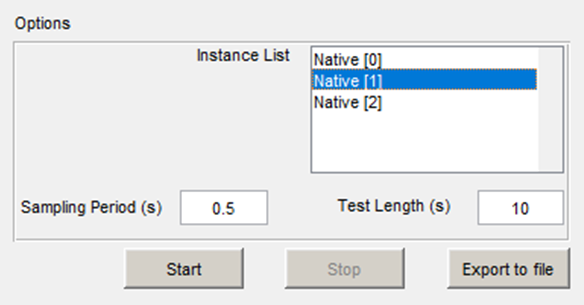
As discussed above, the ‘Sampling Period’ and ‘Test Length’ fields must be entered in order to run the peak profiling. The time unit for both fields are seconds, and the default values are 0.5s sampling period and 10s test length. When ready to start the peak profiling, simply click the ‘Start’ button.
The Peak Profile window will update in real time as the profiling is executed. You can click the Stop button at any time during the profiling, otherwise the peak profiling will complete at the end of the specified length of test:
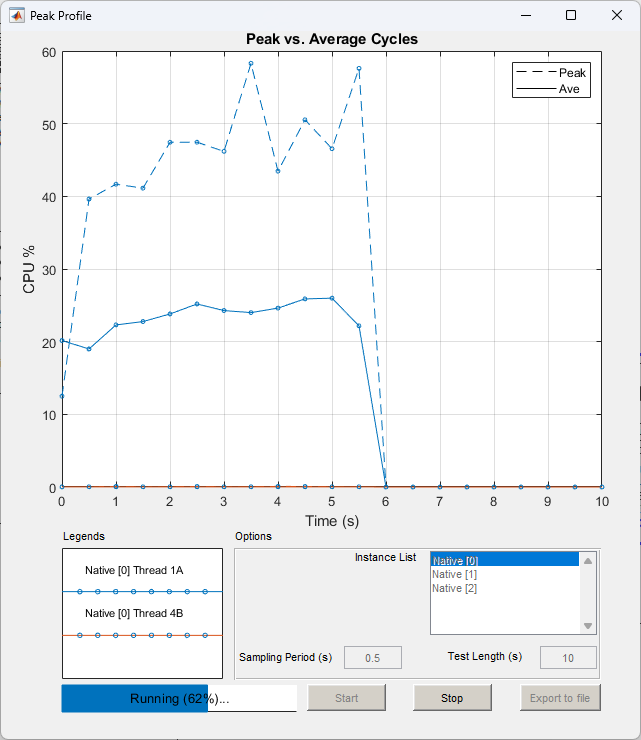
Peak Profiling in Progress
The ‘Peak vs Average Cycles’ graph at the top of the Peak Profiling pop-up window displays peak and average CPU usage percentages of the processor Audio Weaver is running on. If the running .awd has a multi-instance architecture or contains multi-threading, multiple profiling measurements for each Audio Weaver instance and thread will also display. The x-axis is time in seconds and the y-axis is CPU percentage:
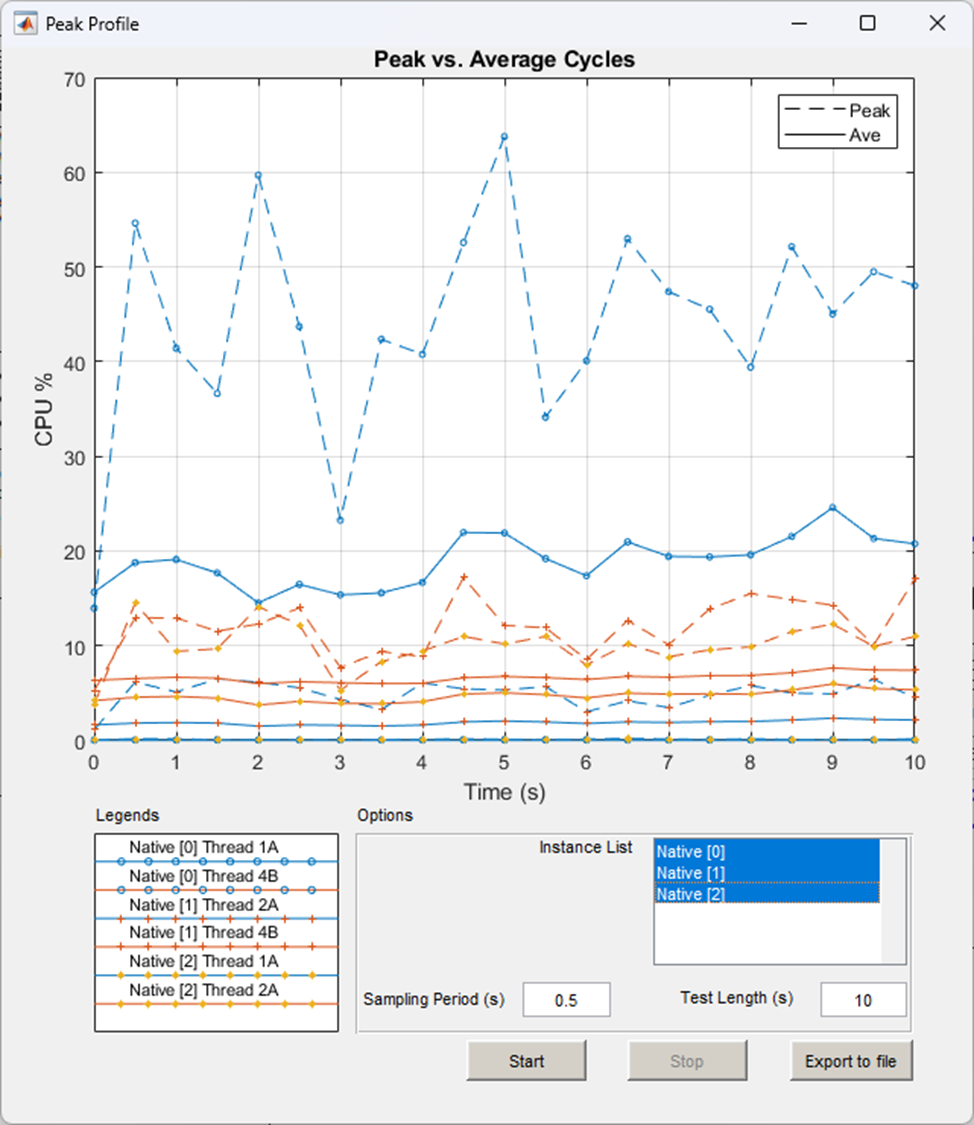
Peak Profiling
The bottom portion of the Peak Profiling pop-up window displays a Legend for the Peak vs Average Cycles line graph and an Instance List to select which Audio Weaver instance profiling measurements to display:
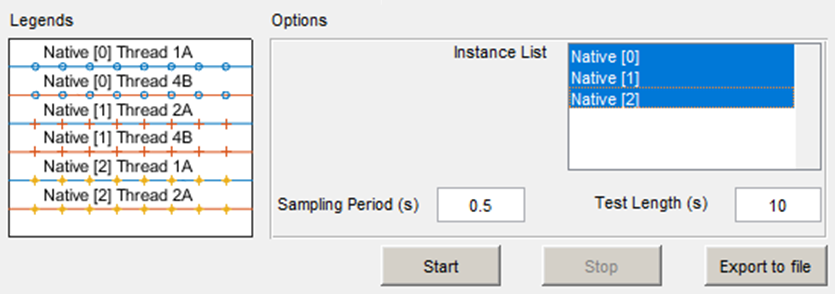
Peak Profiling Legend and Instance List
Manual Profiling
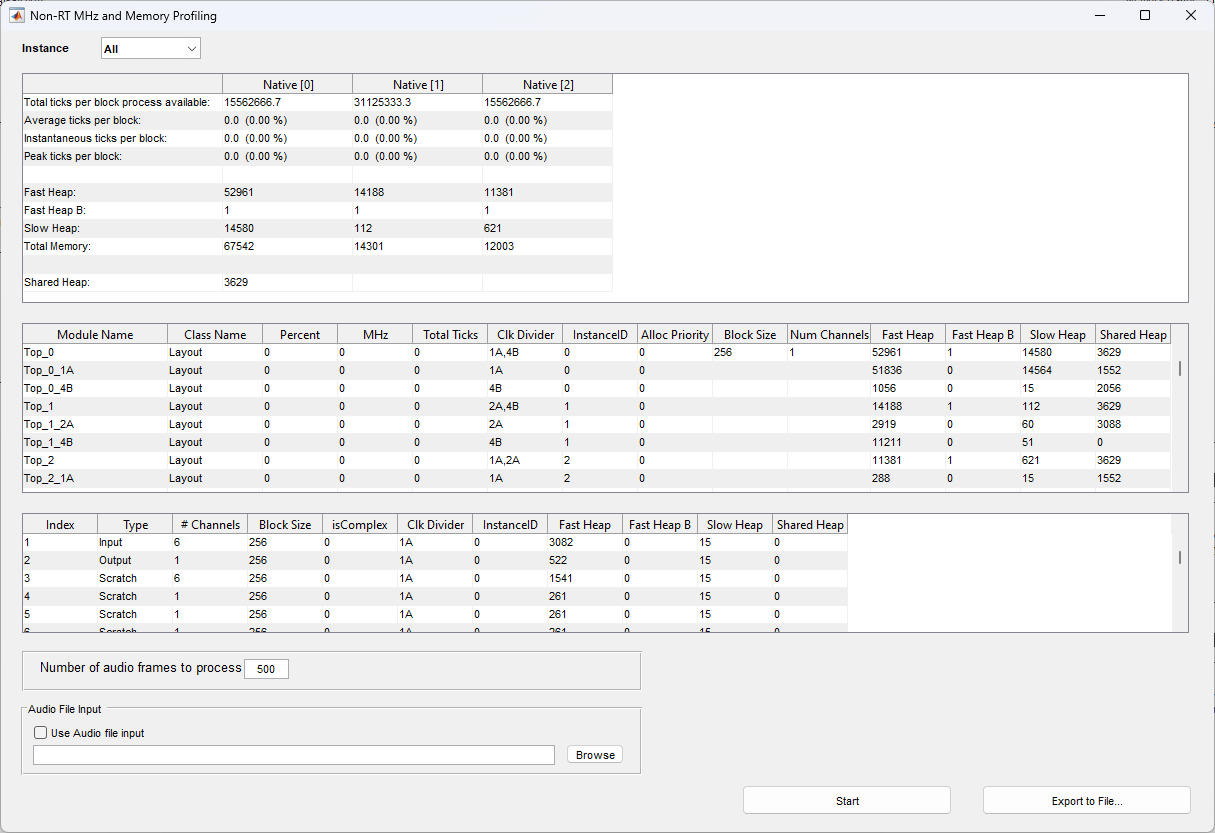
As mentioned earlier in this application note, Audio Weaver also features Manual Profiling, which collects the same exact profiling information as the real-time block by block profiling but in a different manner. Rather than profiling the runtime input audio stream, during manual profiling, real-time processing is halted on the target and all layouts present in the AWD/AWJ signal flow are processed one at a time through tuning commands (pump_layout), for the user specified amount of audio frames. The yielded profiling results may be preferred in some cases, as this decouples discrete layout processing (and thus layout thread priority) from real-time audio device interrupts. This allows for accurate profiling even in cases when the target is not configured for real-time audio, or if a layout is unable to finish executing in the allotted clock cycles (calculated total ticks per block process available).
To Manual Profile an .awd layout, navigate to ‘Tools > Profile Running Layout > Manual Profile Layout’ in the Audio Weaver Designer toolbar while in Tuning Mode:
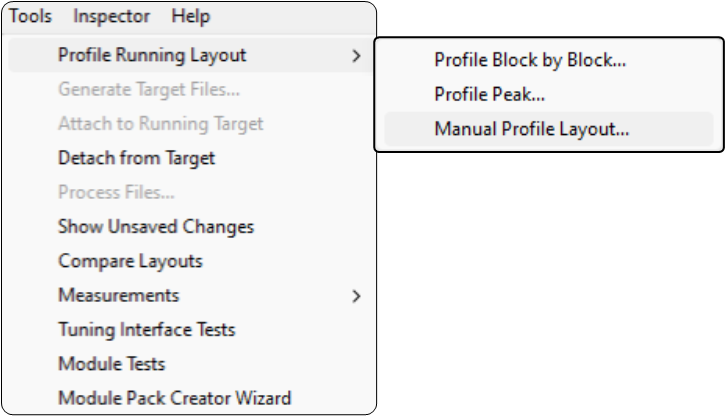
Manual Profile Layout
At the bottom of the Non-RT MHz and Memory Profiling pop-up window, set the Number of audio frames (blocks) to process and an audio file to be used as input audio data:
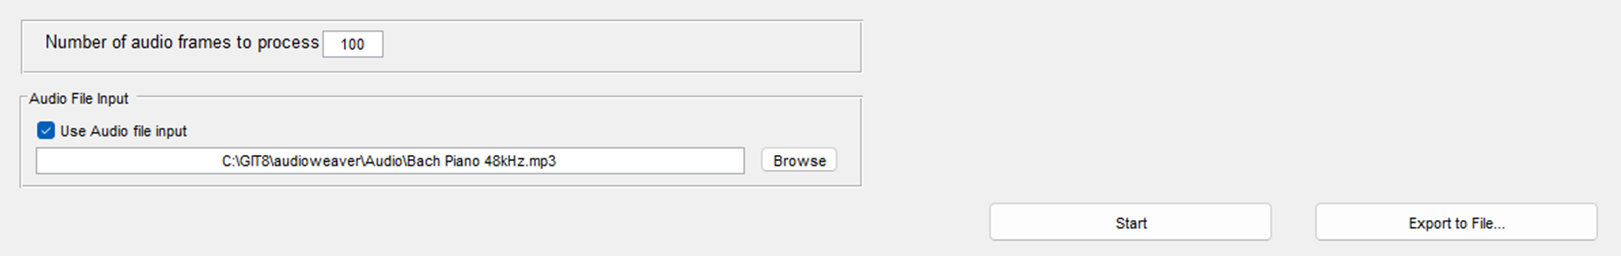
Manual Profile Settings
If no audio file is used as input audio data, the Manual Profiler will use audio data from the specified source selected in the Layout Properties.
Exporting Profiling Data to CSV
All the Audio Weaver profiling utilities allow you to export the profiling data to a comma separated value (.csv) file. All three of the profiling windows (Profile Block by Block, Profile Peak, and Manual Profile Layout) have an ‘Export to File’ Button:

Export to File
Once the ‘Export to File’ button is clicked, users are prompted to choose a file name and path for the profiling data export file:
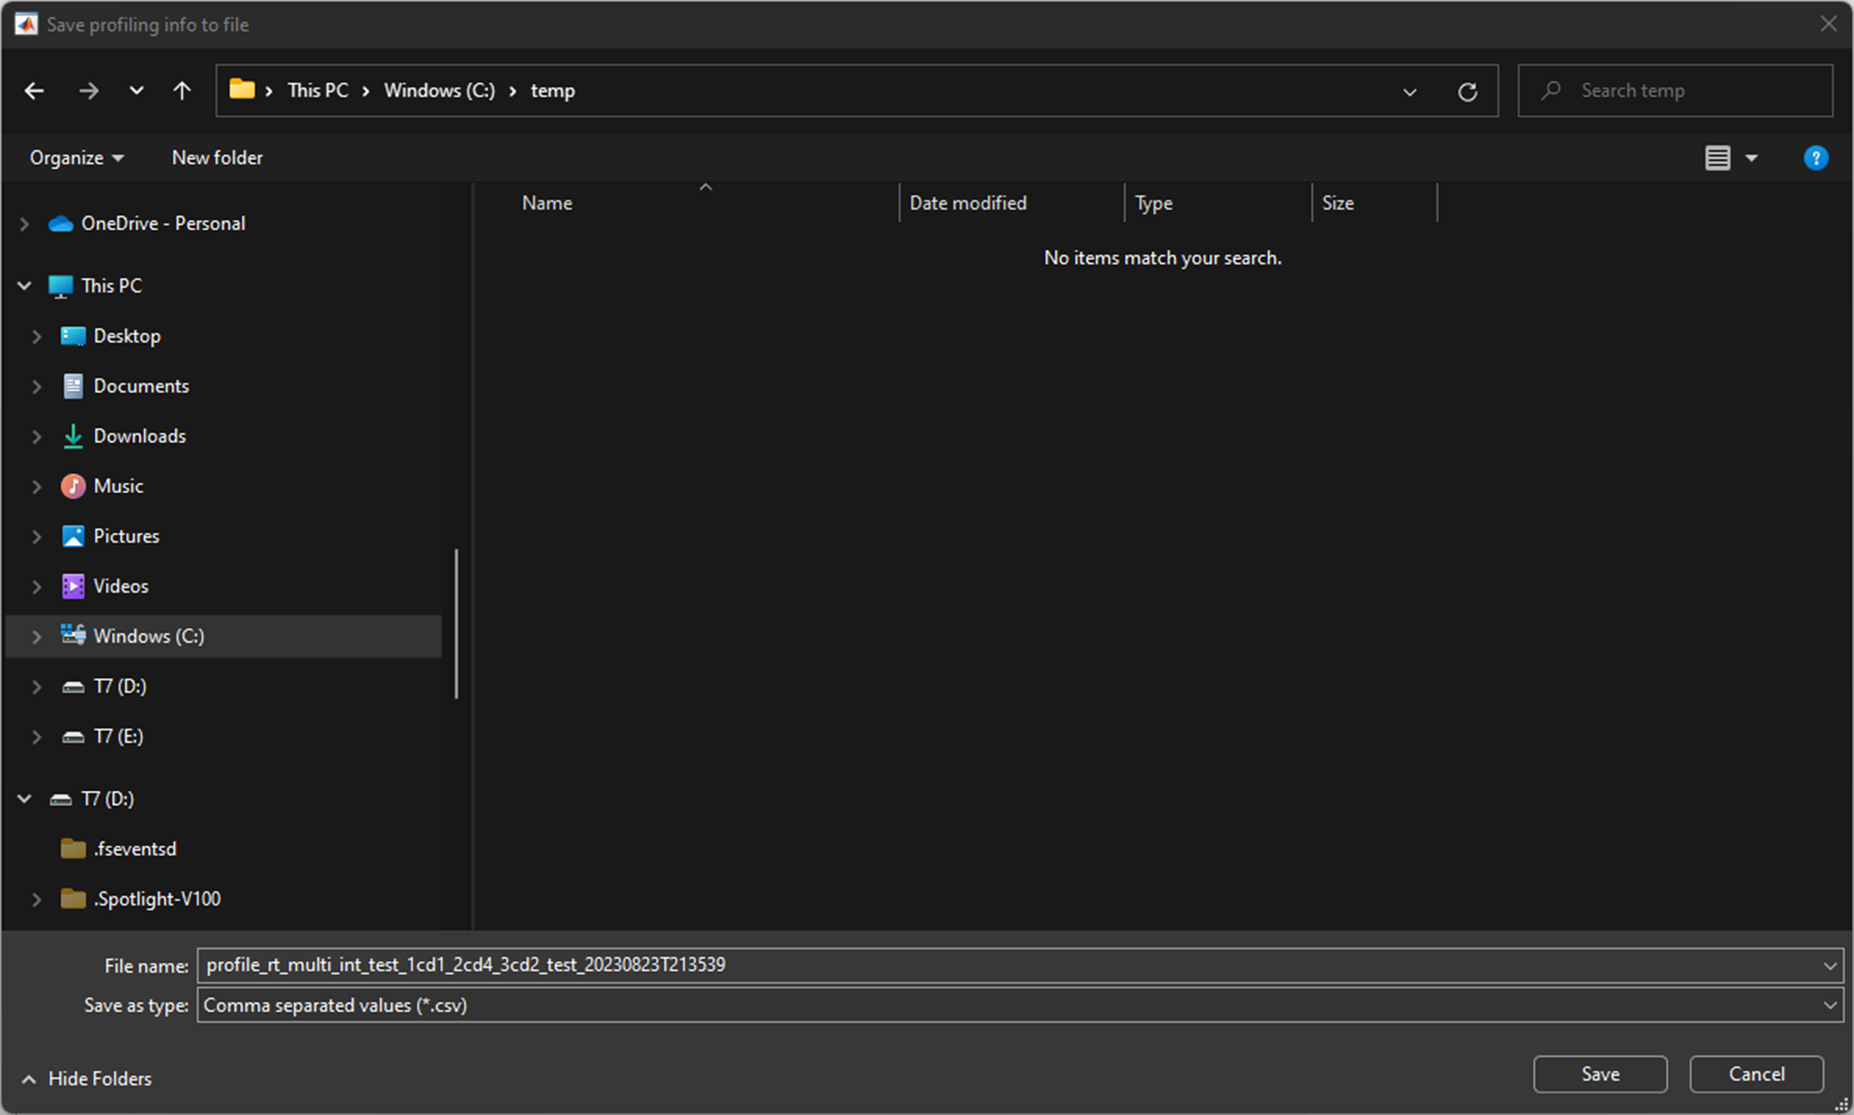
Export Profiling CSV File Name and Path
The default profiling .csv file name follows this naming convention:
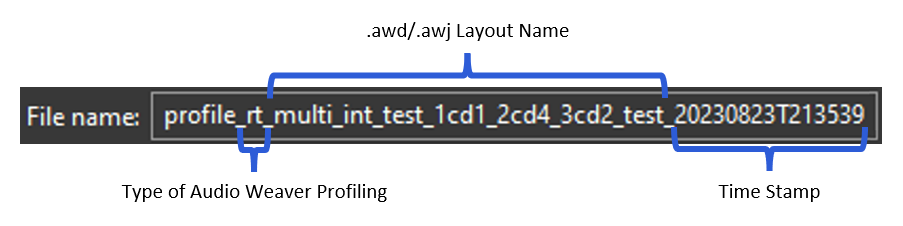
Default CSV File Name
For multi-instance architectures, every Audio Weaver profiling utility enables users to export either profiling data for all instances or individual profiling data for a selected Audio Weaver instance:
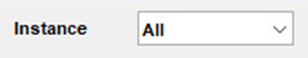
Block by Block and Manual Profiling – Instance Export Option
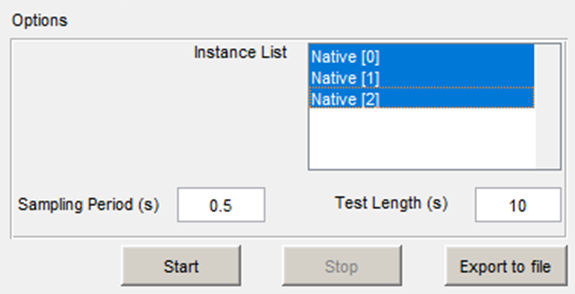
Peak Profiling – Instance Export Options
Peak Profiling – Instance Export Options
For block by block and manual profiling of multi-instance architectures, if profiling data for all instances are selected for export, Audio Weaver will generate one aggregate profiling CSV file and individual CSV files for each Audio Weaver instance in the system:
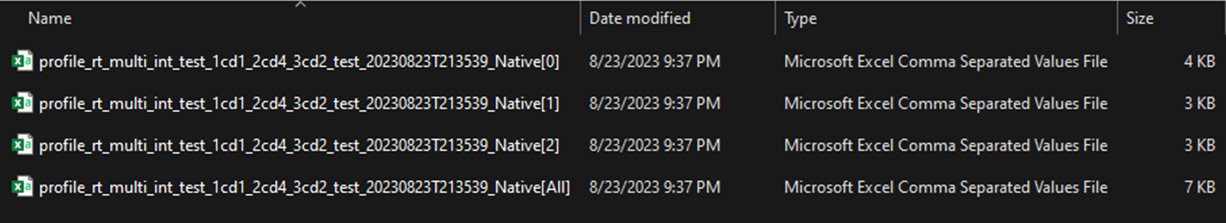
CSV Export for All Audio Weaver Instances
Once exported and saved, users can open the .csv file in Microsoft Excel or equivalent.
The exported block by block and manual profiling .csv files are structured identically to their pop-up windows in Audio Weaver:
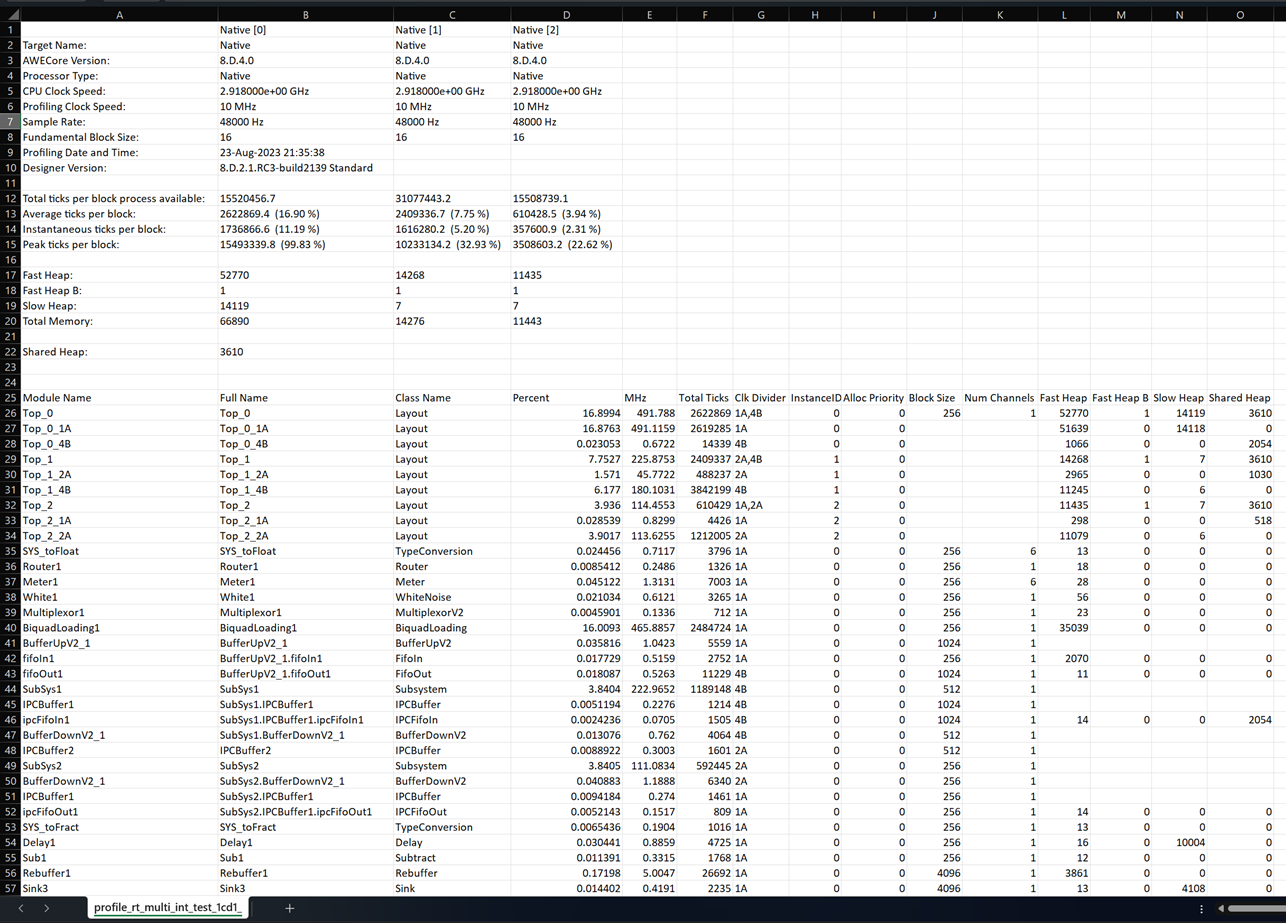
Block by Block and Manual Profiling - Exported CSV
The Profile Peak .csv file is structured as followed, where the Peak and Average Cycle CPU% profile values are indexed by the specified time period in seconds:
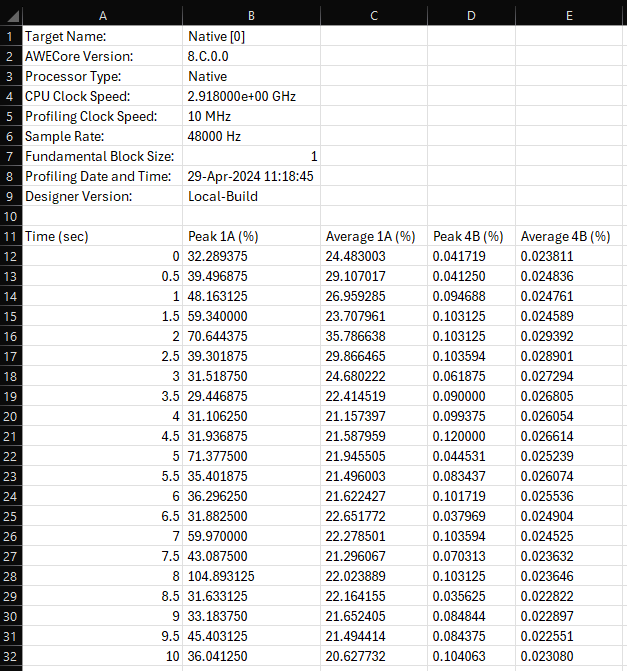
Profile Peak Exported CSV
Profiling Diagrams
Below are some diagrams that further illustrate the real time profiling function in Audio Weaver.
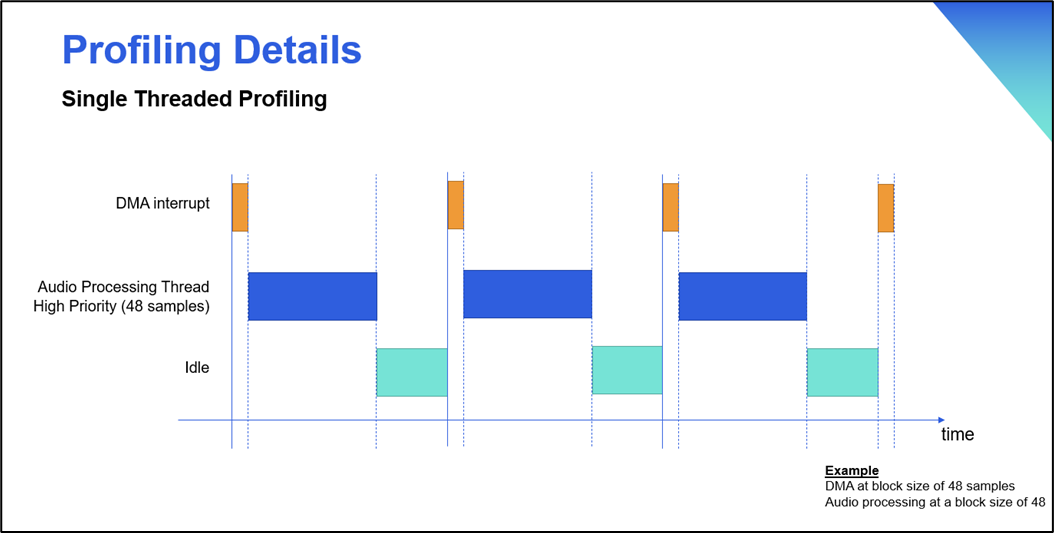
Profiling Details: Single Threaded Profiling
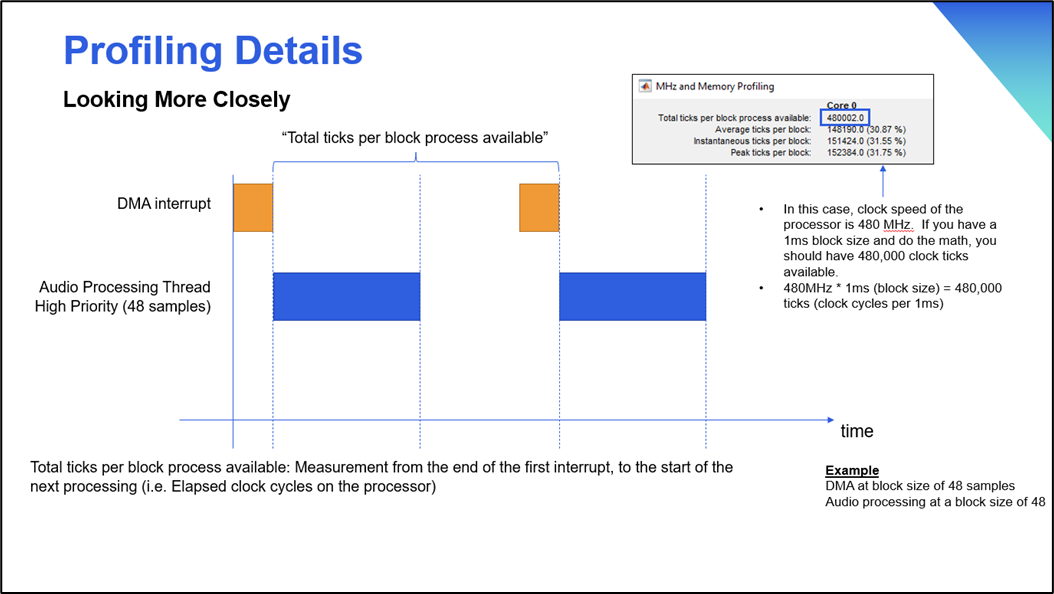
Profiling Details: Total ticks Per Block Process Available
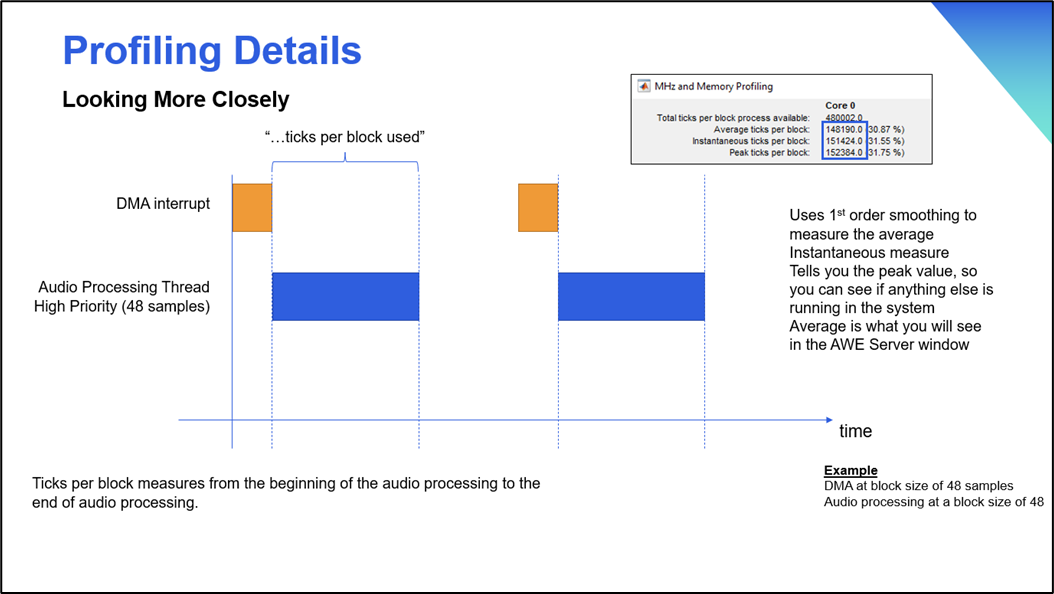
Profiling Details: Ticker Per Block
Profiling Properties
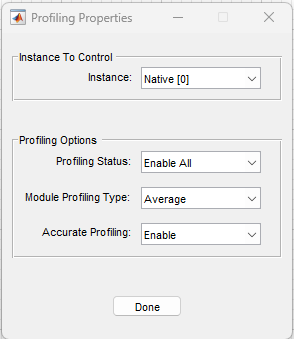
The Profiling Properties menu is available during design time from the Tools → Profiling Running Layout → Profiling Properties menu.
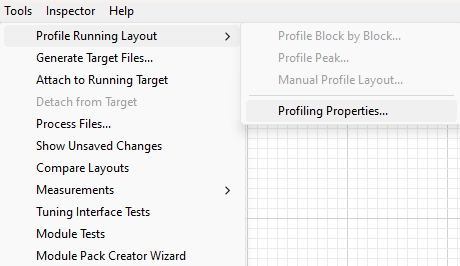
Profiling Properties Menu
This menu lets the user control the profiling options being used on the target system. The profiling options can be applied to each instance on the target independently using the Instance To Control dropdown. The options shown when the menu launches are queried from the currently attached target, so they represent the current state of the target's profiling. The target can control these options using the AWE Core APIs awe_setProfilingStatus and awe_setProfilingOptions.
Profiling Properties Menu
The details of each controllable profiling option are discussed below.
Profiling Status
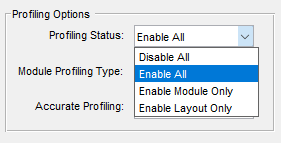
The profiling status dropdown has 4 options for enabling and disabling certain profiling modes.
Profiling Status Options
The two modes that can be controlled are module and layout . Module profiling enables the collection of profiling information on the target for each module in the layout. Layout profiling controls the collection of profiling information for the layouts running on the target. These profiling results are what is shown in the profiling tools discussed in the previous sections; disabling either of these profiling modes will impact what the profiling tools can show. The 4 options are:
Disable All: disables both layout and module profiling. No information will be available in the profiling tools in Designer. The profiling overhead on that target will be minimized, but can not be measured.
Enable All: enables both layout and module profiling. The Designer profiling tools will have complete data, but the overhead on the target could be significant. This is the default value for unmodified systems.
Enable Module Only: enables module level profiling and disables layout profiling. The Peak Profiling tool will not be able to return useful values when using this option. Module level profiling provides the most detailed information, but is the most computationally expensive part of profiling. This setting is not commonly used, since disabling only layout profiling sacrifices the highest level profiling information and does not reduce CPU load significantly.
Enable Layout Only: enables layout level profiling and disables module profiling. The Block-By-Block and Manual Profiling tools will not be able to show detailed module profiling when this option is selected. This setting can be useful to determine the overall CPU load of the layout without the computational load of module profiling. Comparing the overall layout load of this setting to Enable All will show the overall computational cost of collecting module level profiling information. On some systems this is a trivial cost, but on other systems it can be significant. Using this option can provide more processing margin for the layout at the expense of profiling observability.
Module Profiling Type
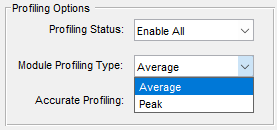
This option controls whether to collect average or peak profiling for modules, which is ultimately what will be shown in Block-By-Block and Manual Profiling results.
Module Profiling Types
The default is average, which will provide a smoothed value for each module’s profiling. Average profiling provides a stable view of the CPU usage of a module, but intermittent and potentially unexpected peaks in cycles will be smoothed over and missed.+
The peak module profiling type will track the largest instantaneous cycle over the duration of layout processing. The peak value for each module can increase over time, so refreshing the profiling information can be a good way to see if unexpected and significant peaks are occurring for some or all modules on the system. When this happens, it can mean that the target system has threads that are pre-empting the audio processing threads and causing false CPU loads on the module that happened to be running when the thread got pre-empted. See the Accurate Profiling section below for a related discussion.
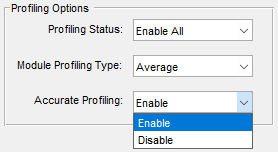
Accurate Profiling
The accurate profiling option controls over the thread pre-emption profiling correction logic running in the AWE Core. This feature is enabled by default.
Accurate Profiling Option
Layouts that use multiple clock dividers will execute on multiple threads, each at their own priority level and block-rate. As these layouts are processed, it is likely that a lower priority layout is interrupted by a higher priority thread. The result is that the pre-empted layout’s profiling will include the pre-empting layouts processing time. This leads to higher measured profiling cycles than actual cycles.
When accurate profiling is enabled, the pre-emption of a layout’s processing is corrected by the AWE Core framework. This correction logic results in more accurate profiling for multi-threaded layouts, but also has an impact on CPU load. The disable option allows the user to skip this correction altogether.
There can be other threads or processes in the system that cannot be corrected since they exist outside the measurement framework. This can include audio callbacks or tuning interfaces in the application running AWE Core. The Peak Profiling tool and the peak module profiling type are useful ways to analyze the stability of the system’s profiling.
CPU and Memory Loading Modules
The CycleBurner, CycleBurnerSet, BiquadLoading, FIRLoading and MemoryLoading Modules intentionally consume processing cycles on the target processor. They are useful for load/stress testing.
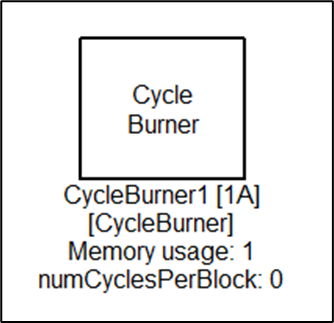
CycleBurner Module
The CycleBurner intentionally consumes a user-specified number of clock cycles (cycles are at the rate of the target’s Profile clock rate displayed in AWE_Server). You can increase the number of clock cycles used by CycleBurner by adjusting the ‘numCyclesPerBlock’ slider of CycleBurner’s inspector. Using this technique we can increase the number of cycles until we start to hear distortion in the program material that is being processed by the signal flow.
CycleBurner Module
Since the CycleBurner relies on a specified number of cycles to elapse to finish processing, systems with multiple threads running can cause inconsistent CPU loading when using this module. For example, if the thread running the CycleBurner, set to consume 10,000 cycles, is preempted by another thread for 6,000 cycles, the CycleBurner itself will only process for 4,000 cycles. The FIR and Biquad Loading modules described below can provide more predictable CPU loading in multi-threaded systems.
CycleBurnerSet Module
There is also a CycleBurnerSet module that burns cycles in the Set function rather than the Process function. This can be a good way to test the robustness of the target system implementation, since long processing in the Set function should never cause dropouts in audio processing. The CycleBurnerSet module relies on a trigger to burn the cycles.
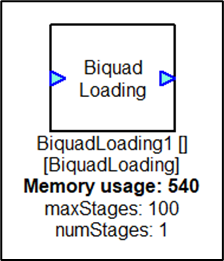
BiquadLoading Module
The BiquadLoading Module simulates the loading of biquad filters. This module is used for CPU load testing purposes and implements a large number of cascaded Biquad filters set to have passthrough coefficients. At instantiation time, you specify the maximum number of filter stages that you would like to simulate. Then at run-time you can vary the number of filters running. This makes the CPU work harder. Internally, the module uses the BiquadCascade module to implement the filtering.
BiquadLoading Module
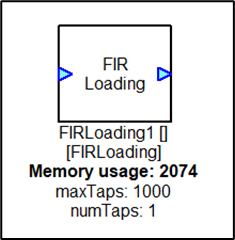
FIRLoading Module
The FIRLoading Module simulates FIR filter loading. This module is used for CPU load testing purposes and implements a large number of FIR filter taps. At instantiation time, you specify the maximum number of filter taps that you would like to simulate. Then at run-time you can vary the number of filter taps. This makes the CPU work harder since more filter taps are running. Internally, the module uses the FIR module to implement the filtering.
FIRLoading Module
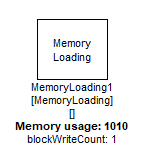
MemoryLoading Module
This module is used to check the memory bandwidth of the target. At instantiation time you specify the size of the memory buffer (memSize) and in which heap it should be allocated (memHeap). Then at run time, the module writes a block counter value into every value of the array. It repeats this blockWriteCount times per block process. That is, every time the processing function is called, the module performs a total blockWriteCount*memSize memory write operations. All write operations write the current value of the block counter.
MemoryLoading Module
Additional Notes on Audio Weaver Profiling
Since system and other interrupts can and sometimes will preempt audio processing, every profiling measurement has a first order low pass filter to mitigate preemption spikes. The low pass filters are designed so that the time for the profiling values to stabilize is less than 5 seconds. The output of these low pass filters represents the average cycle profiling numbers.
In order for profiling to be accurate for embedded targets, the AWE Core relies on a suitable operation to retrieve the system cycle count. This operation can be implemented internally in the AWE Core library configuration only if the method supported by the target is known at compile time. If the cycle count retrieve function is not implemented in the AWE Core library configuration, then the user must supply functions that retrieve the system cycle count as part of the application. The core speed and the units of the retrieved cycle counts must be correctly defined by the user for the profiling to be accurate.
Audio Weaver Server Profiling
While an .awd is running in Audio Weaver, the Audio Weaver Server provides real time CPU and Memory profiling of the entire layout:
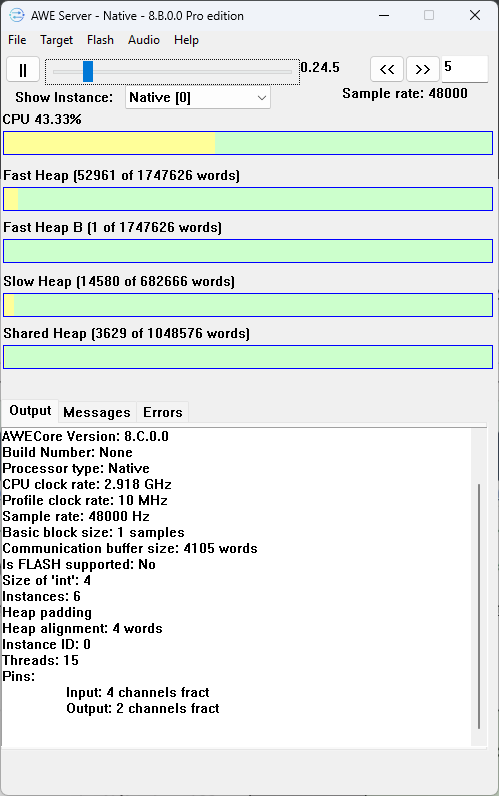
Audio Weaver Server Profiling
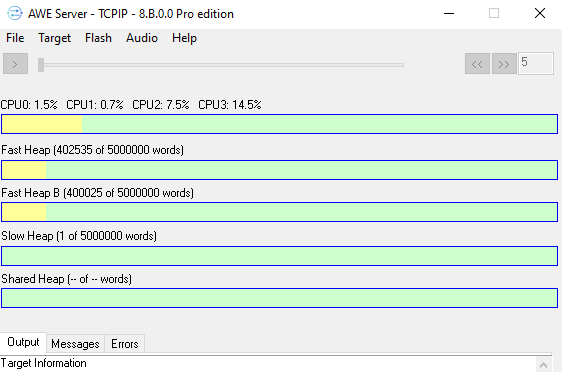
Server Profiling on Multi-CPU Targets
AWE Core may be running in multiple threads on several CPUs in some instances. The application is not aware of which CPU the thread is running on by default. This means that without some extra work, the default display of CPU % cannot be trusted for multi CPU targets as the assumption will be that all threads run on a single CPU.
If CPU affinities are enabled on the target, server will display text percentages for each CPU that a layout is running on. The CPU percentage indicator bar will show the load for the CPU which has the highest load. Any CPUs without an associated layout will not be shown.
Setting and getting CPU affinities is done through the AWE Core functions awe_fwSetLayoutCoreAffinity and awe_fwGetLayoutCoreAffinity. These functions are described in the AWE Core API documentation. Customers utilizing AWE Core OS have this feature built in as described here.