
Debugging Custom Modules
About This Guide
This Application Note explains how to trace your custom module code in Native mode in Visual Studio and MATLAB.
Prerequisites
MATLAB R2021b or later with Signal Processing Toolbox license
Microsoft Visual Studio 2019
DSP Concepts Audio Weaver Pro License
DSP Concepts Custom Module Developer’s License
The Custom Module Developers’ Guide
Follow the instructions at Creating Custom Modules (dspconcepts.com) to get started developing code for your module.
Build the Example modules
In your Audio Weaver Pro installation folder, open the Visual Studio 2019 solution file
C:\DSP Concepts\<AWE Pro Path>\AWEModules\Source\Examples\ Examples_VS2019.sln
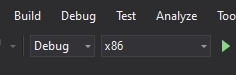
Set the configuration for “Debug x86”.
3. The following step is not necessary if FrameDll.lib is already in C:\DSP Concepts\<AWE Pro Path>\Bin\win32-vc142-dbg.
Copy the file FrameDll.lib from
C:\DSP Concepts\<AWE Pro Path>\Bin\win32-vc142-rel to C:\DSP Concepts\<AWE Pro Path>\Bin\win32-vc142-dbg.
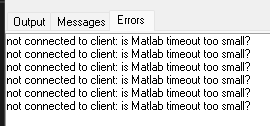
If the file is not found, you will see:

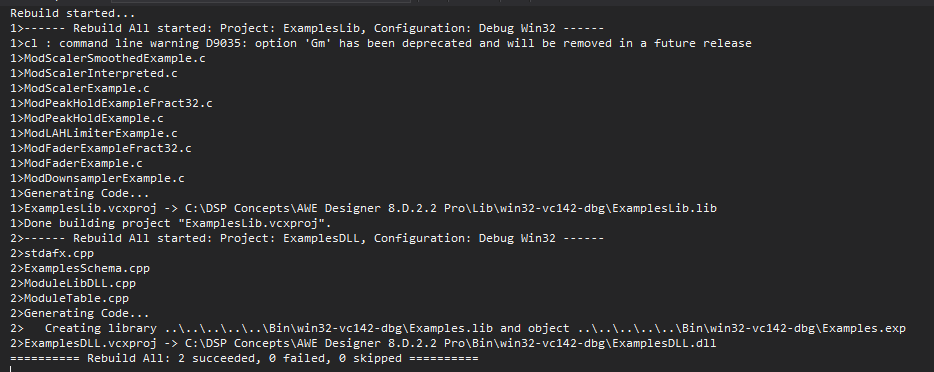
Rebuild the solution to recompile everything. Successful output is shown below.
Copy the ExamplesDLL.dll and ExamplesDLL.pdb files to your Audio Weaver’s Bin folder, e.g.
C:\DSP Concepts\<AWE Pro path>\Bin\win32-vc142-rel
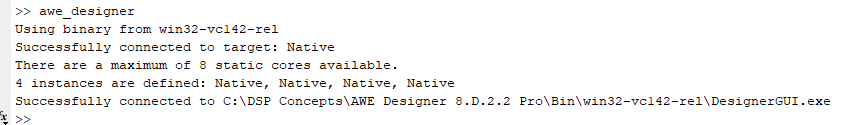
Run Audio Weaver from MATLAB.
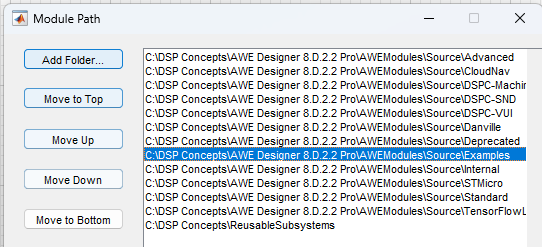
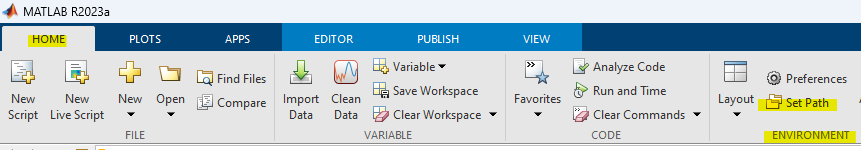
Confirm that the Examples folder is in your module path (File->Set Module Path).
Debugging MATLAB code
At some point you may wish to stop the MATLAB code and single step to see which path it takes, and/or look at variables.
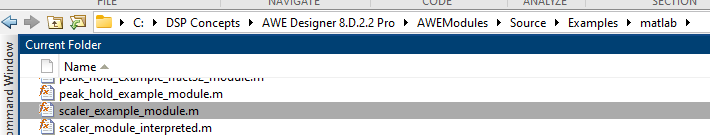
Make sure that the module’s “matlab” folder is either the current folder, or in the MATLAB path.
or
We’ll demonstrate the Scaler Example module.
Open the file “scaler_example_module.m”.
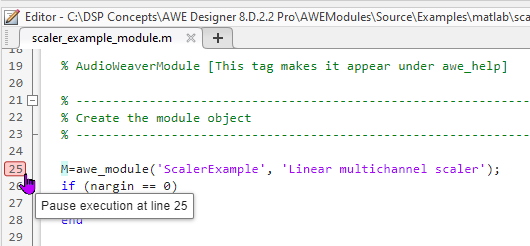
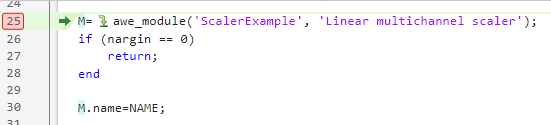
To add a breakpoint to your MATLAB code, click on the line number. Add a breakpoint on the “awe_module” instruction line.
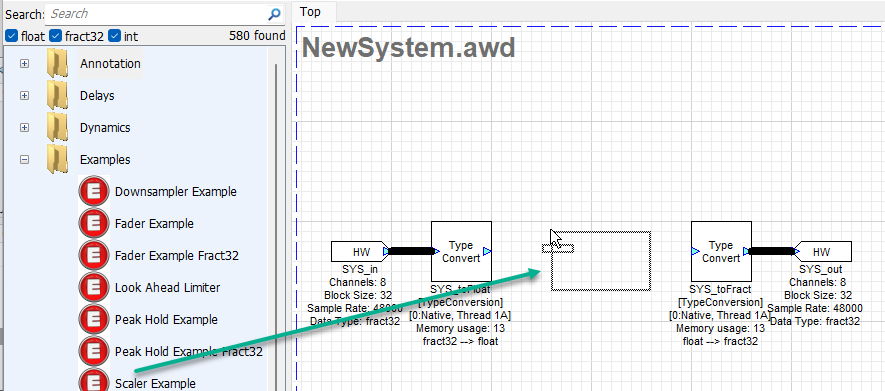
In this example layout, we have started by removing the deinterleave and interleave modules from the default layout. Find the “Examples” folder in the Module Browser and drag a Scaler Example module into your layout.
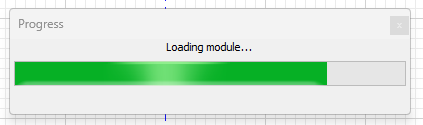
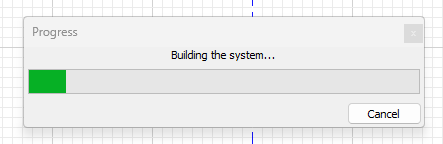
When you drop the module, you see the “Progress” dialog continuously. That’s because you hit the MATLAB breakpoint.
Return to MATLAB.
The current location is indicated by a green arrow.
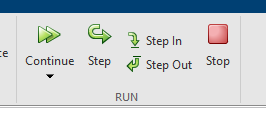
You can now either single step, stop or continue (resume execution until the next breakpoint).
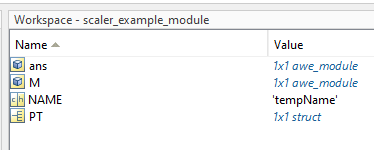
Check the value of variables in the “Workspace”.
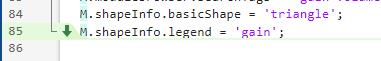
If you single step past the end of the current MATLAB file, you will see a downward pointing green arrow. Generally speaking you should click on “Continue” at this point rather than “Step”.
If you see “Run”, this means the program is running and we are not at a breakpoint. At this time, confirm that the program is running. If you see “Continue”, click on it again until you see “Run”.
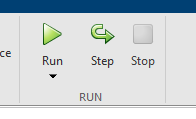

Do not click on “Run”. “Run” in this context is a bit misleading. If you click on “Run” here, it will attempt to run the MATLAB script directly, which usually does not work and is not what you want to do.
The Progress dialog should disappear, and your module should be visible in the layout.
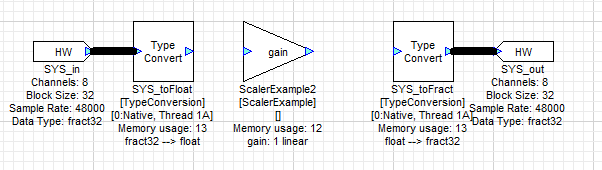
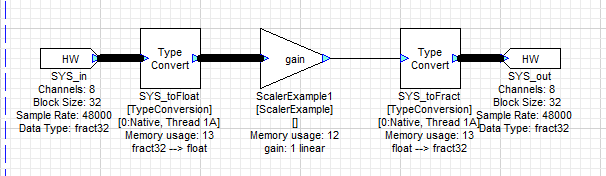
Complete the layout as shown:
Now build and run the layout.

No further MATLAB breakpoints are encountered in this simple example. More elaborate modules may contain additional MATLAB functions.
Debugging C/C++ code in Visual Studio 2019
You should already have the Examples_VS2019.sln solution open in Visual Studio 2019.
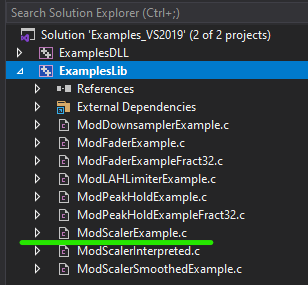
Locate ModScalerExample.c in the Solution Explorer and open it.
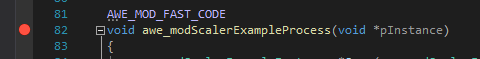
Add a breakpoint at the awe_modScalerExampleProcess() function.
Make sure that AWE_Server is running and configured properly for the Native target.
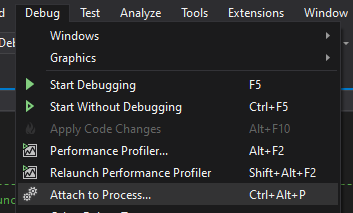
In VS2019, select “Debug->Attach to Process”.
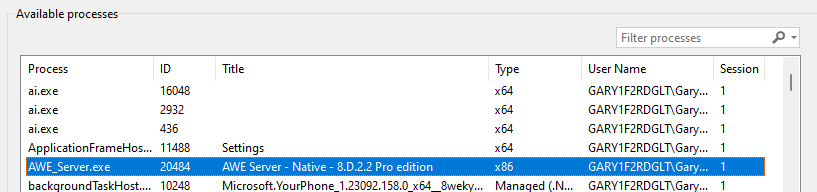
Choose “AWE_Server.exe” from the list, then click on the “Attach” button.
Run your layout. You should hit the breakpoint on the awe_modScalerExampleProcess() function.
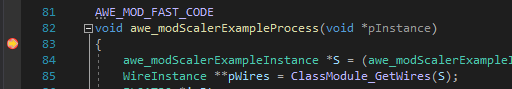
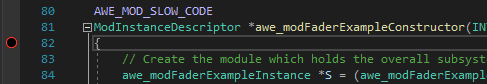
The red dot indicates the breakpoint while the yellow arrow shows the next line that will be executed.
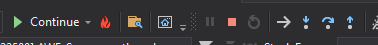
Use VS2019’s step/continue controls to trace through the code.
Since we interrupted the Processing() function, AWE Designer (the GUI/client) usually loses communication with AWE Server. You’ll just return to design mode with no error or warning in this case.
However, AWE Server is still running (unless a bug caused it to crash) and you can hit the Process() function again and again. Each pass through the Process() function processes one block’s worth of audio data.
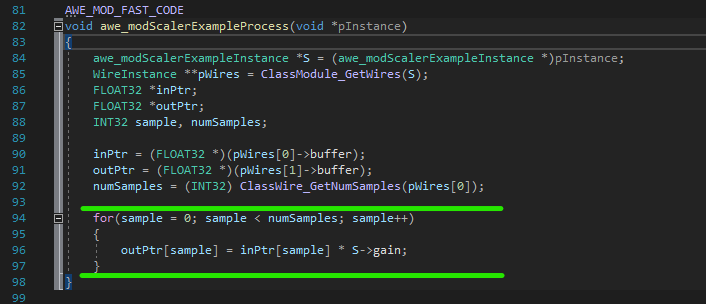
The green lines highlight the inner loop which processes all samples in the block one by one.
Debugging strategies
The Scaler Example, due to its simplicity, does not implement many of the possible functions available to module developers. The following example demonstrates a more elaborate module.
Let’s look at the Fader Example module now.
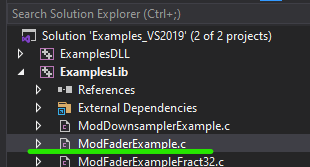
In the VS2019 Solution Explorer, open ModFaderExample.c.
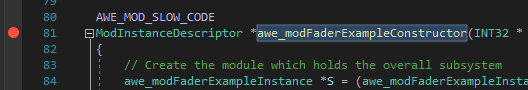
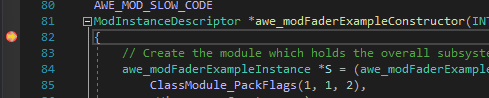
Put a breakpoint on the awe_modFaderExampleConstructor() function.
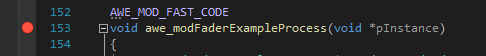
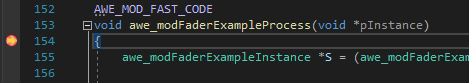
Put a breakpoint on the awe_modFaderExampleProcess() function.
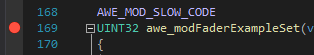
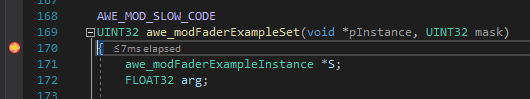
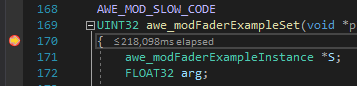
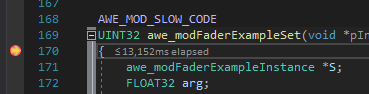
Put a breakpoint on the awe_modFaderExampleSet() function.
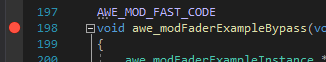
Put a breakpoint on the awe_modFaderExampleBypass() function.
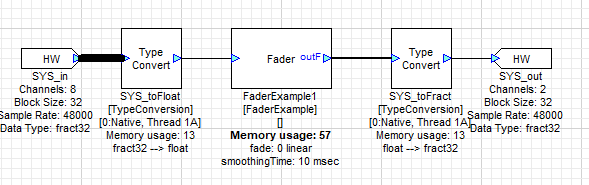
Start a new layout and remove the DeInterleave and Interleave modules.
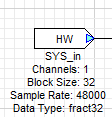
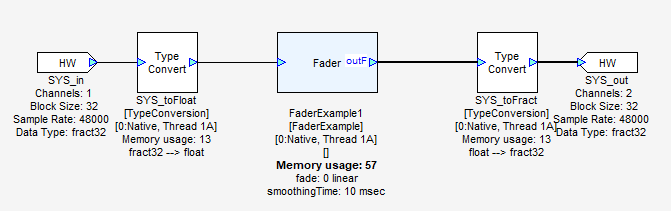
Drag in the Fader Example module and complete the layout as shown.
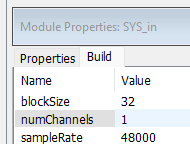
Set numChannels on the input pin to 1.
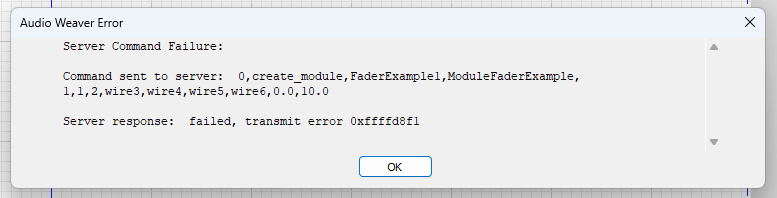
Build and run the layout. This time, we see a more detailed error when we hit the breakpoint.
AWE Server is still “there”, but we have stopped it, so the Designer Application times out. This is all normal.
First, we hit the Constructor() breakpoint. Click on “Continue”.
Next, we hit the Set() function breakpoint. Click on “Continue”.
No further breakpoints are encountered. AWE Server comes to the foreground showing:
Let’s reconnect AWE Designer to AWE Server.

Build and run again.
We do not hit the Constructor() function this time as the module has already been instantiated. The first breakpoint is the Set() function.
Again, if we hit “continue”, then we lose control.
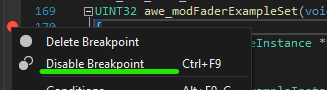
Disable the breakpoints on the Constructor() and Set() functions.
Reconnect AWE Designer to AWE Server.
Reattach the debugger to AWE Server.exe
Build and run again.
This time we hit the Process() function.
Disable the breakpoint on the Process() function and click on “Continue”.
Reconnect AWE Designer to AWE Server.
Reattach the debugger to AWE Server.exe
Build and run again. This time the layout is not interrupted and runs.
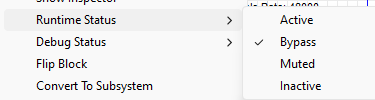
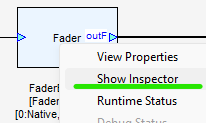
Use the Fader’s popup menu to bypass the module.
Now we hit the Bypass() function breakpoint.
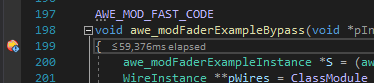
Disable the breakpoint on the Bypass() function and click on “Continue”.
Reconnect AWE Designer to AWE Server.
Reattach the debugger to AWE Server.exe
Build and run again. This time the layout is not interrupted and runs. Enabling or disabling “Bypass” does not trigger a breakpoint.
Re-enable the breakpoint on the Set() function.
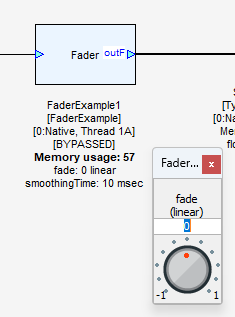
From the context menu, select “Show Inspector”.
The inspector is displayed and the breakpoint on Set() is hit.
This sequence is not meant to demonstrate all possible scenarios. It demonstrates:
Certain functions are called in response to certain events.
Functions can be called at different times with different parameters to accomplish different things (e.g. the Set() function).
You may have to disable previous breakpoints to proceed further due to the interruption of communication with the Designer GUI client.
This guide has asked you to hit “Continue” at each breakpoint, just to understand what makes each one happen and get to the next one. It is highly recommended that you additionally single step through the various functions provided in the Example modules.
Modifying C code in VS2019
While it is possible to make changes directly to your ModModuleName.c source file in Visual Studio and recompile it to quickly check changes, remember that the file is generated from the “Inner” source code fragments and will be overwritten the next time you run the module’s “make” MATLAB script. Be sure to copy any valid changes back to your Inner .c files!
Bad things can happen
AWE Server can crash. It may be necessary to restart it from AWE Designer.
AWE Designer can crash. It may be necessary to restart it.
It may be necessary to restart MATLAB.
It may be necessary to force kill MATLAB using Task Manager.
You may have to reattach the VS2019 debugger to AWE Server (use “Debug->Reattach to Process”)